
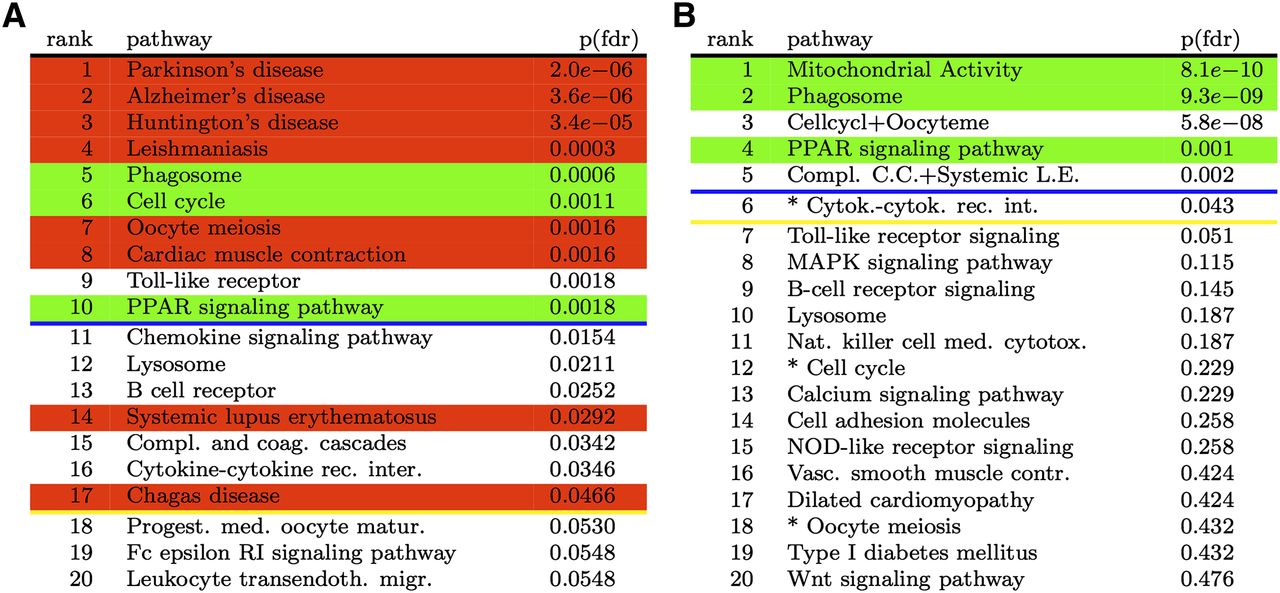
The results of the ORA analysis in the fat remodeling experiment for the comparison between days 3 and 0, before (A) and after (B) correction for crosstalk effects. All P-values are FDR corrected. The lines show the significance thresholds: (blue) 0.01, (yellow) 0.05. Pathways highlighted in red represent pathways not related to the phenomenon in analysis, while pathways highlighted in green are those for which we know, with reasonable confidence, are involved in the given phenomenon. The white background indicates pathways for which we do not have conclusive information on their involvement (or lack of ) with the phenomenon in analysis. (A) The top 20 pathways resulting from classical ORA before correction for crosstalk. The top four pathways are not related to fat remodeling. (B) The top 20 pathways after correction for crosstalk. Pathways ranked 1, 3, and 5 are modules that are functioning independently of the rest of their pathways in this particular condition. Starred pathways are pathways edited by removing such modules. Note the lack of any obvious false positive above the significance threshold(s).


