
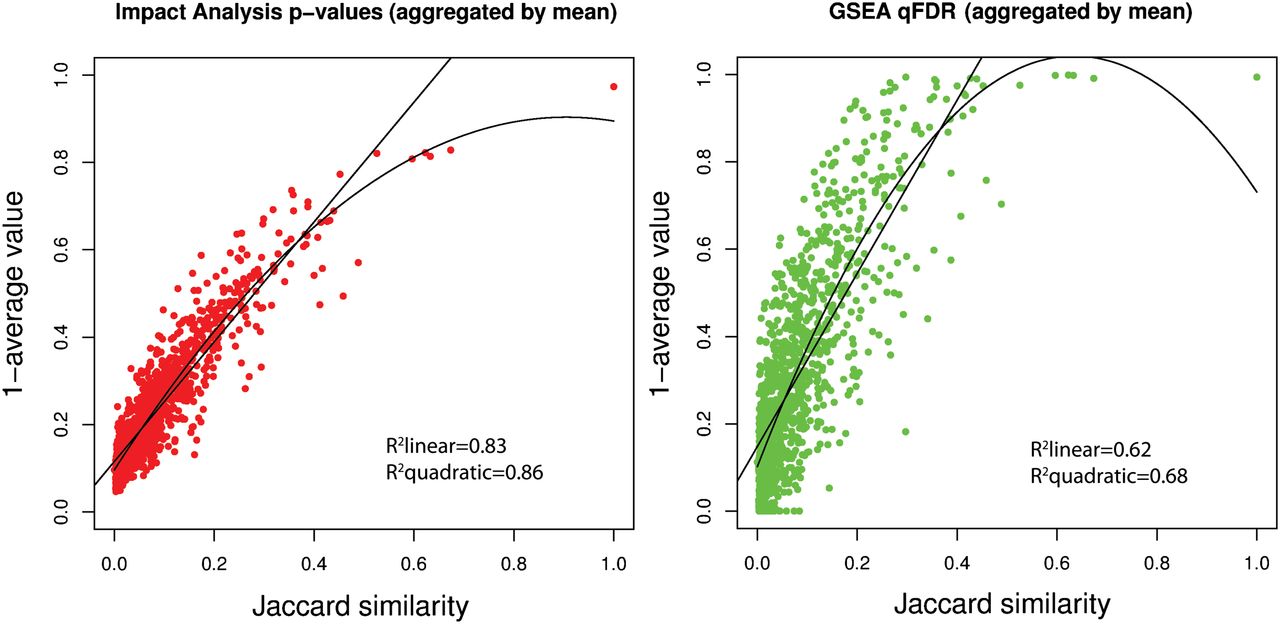
Figure 2.
Pathway coupling in the impact analysis (left panel) and GSEA (right panel). Each point represents the mean of all P-values of all random trials for pairs with the same Jaccard index. The lines represent the fitting of linear and quadratic models. Both models show a strong dependence between the P-value coupling and the Jaccard index.


