
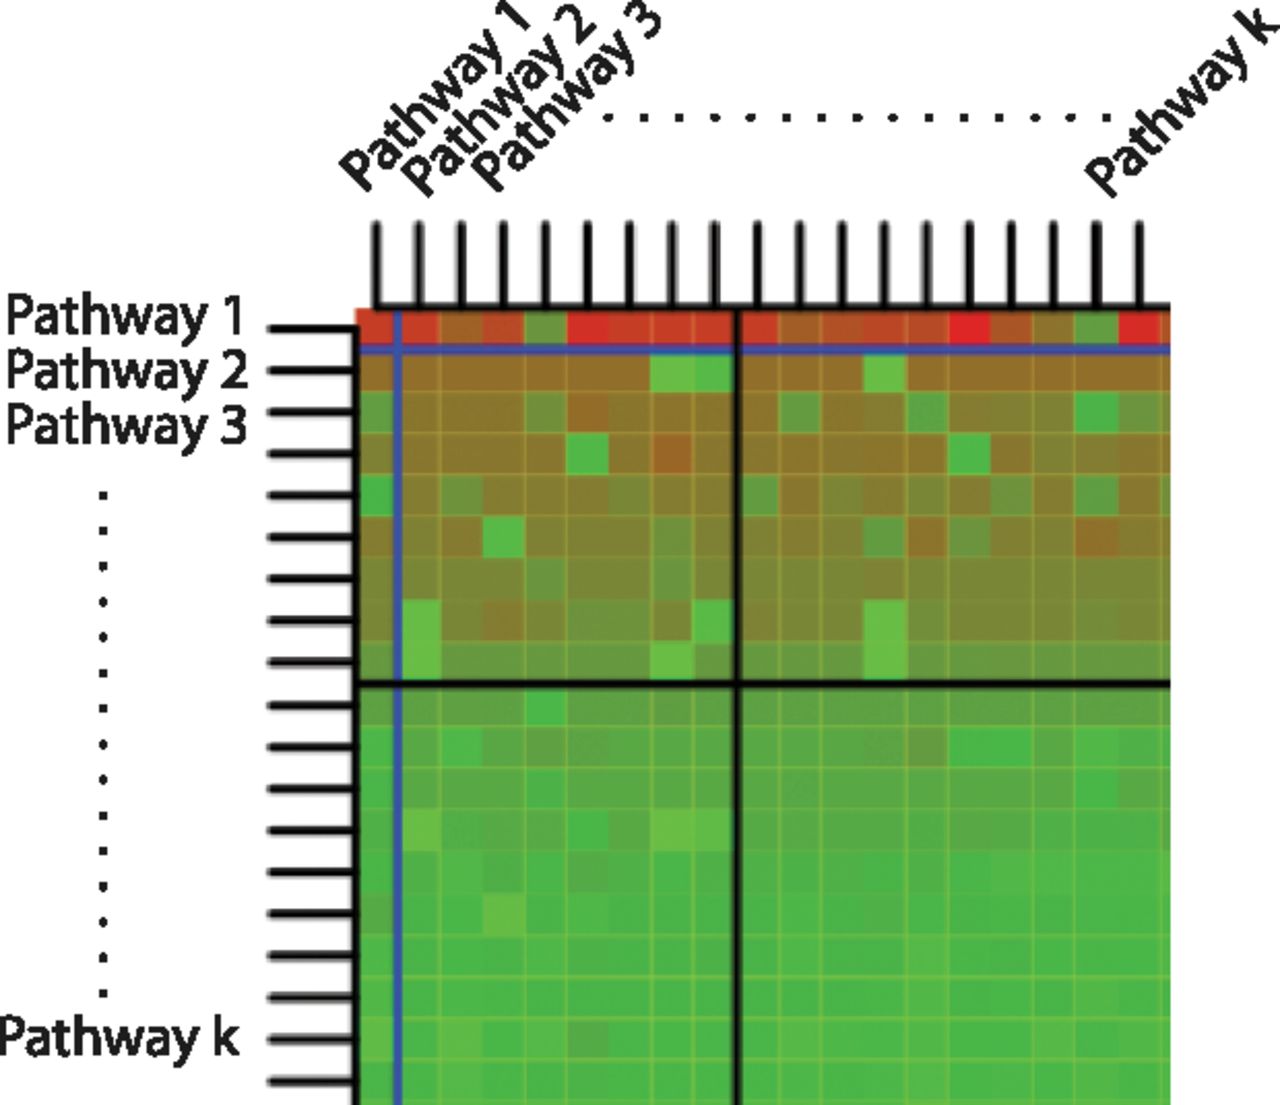
Figure 10.
Example of a crosstalk matrix. On the diagonal, we find the classical overrepresentation analysis, ordered by P-value. The blue line represents the 0.01 significance level, while the black line represents the 0.05 significance level. The P-values in the matrix have been log-transformed (base 10 log), and the sign of the result has been inverted. The color of the cell represents the P-value: bright red for P-values close to zero, bright green for P-values close to 1.


