
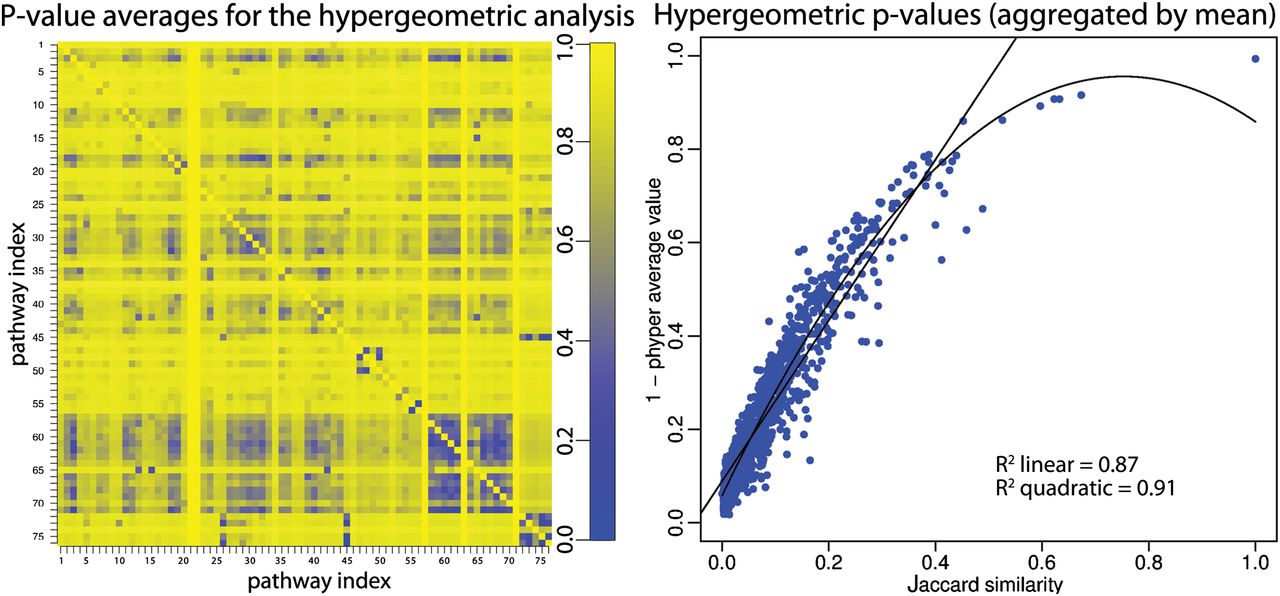
Pathway coupling in the Fisher's exact test P-values. (Left panel) A number of random genes were chosen from a “bait” pathway i such that its Fisher's exact test P-value is 0.01. Other genes were chosen randomly from all other pathways (acting as preys), up to a constant number (n = 100). The elements [i, j], where i ≠ j, represent the mean of the distribution of P-values for 1000 random trials using pathway i as bait and pathway j as prey. The data show that a considerable number of pathways influence each other through a “coupling” of the P-values. For instance, row 3 of the matrix shows that when pathway 3 is chosen to be significant, several other pathways (e.g., columns 57 to 70) also tend to be significant (dark shades of blue represent significant P-values). (Right panel) Each point represents the average of the P-values of all the random trials for pairs with the same Jaccard index. The lines represent the fitting of linear and quadratic models. Both models show a strong dependence between the P-value coupling and the Jaccard index. Similar results were obtained for GSEA and impact analysis (see Fig. 2).


