
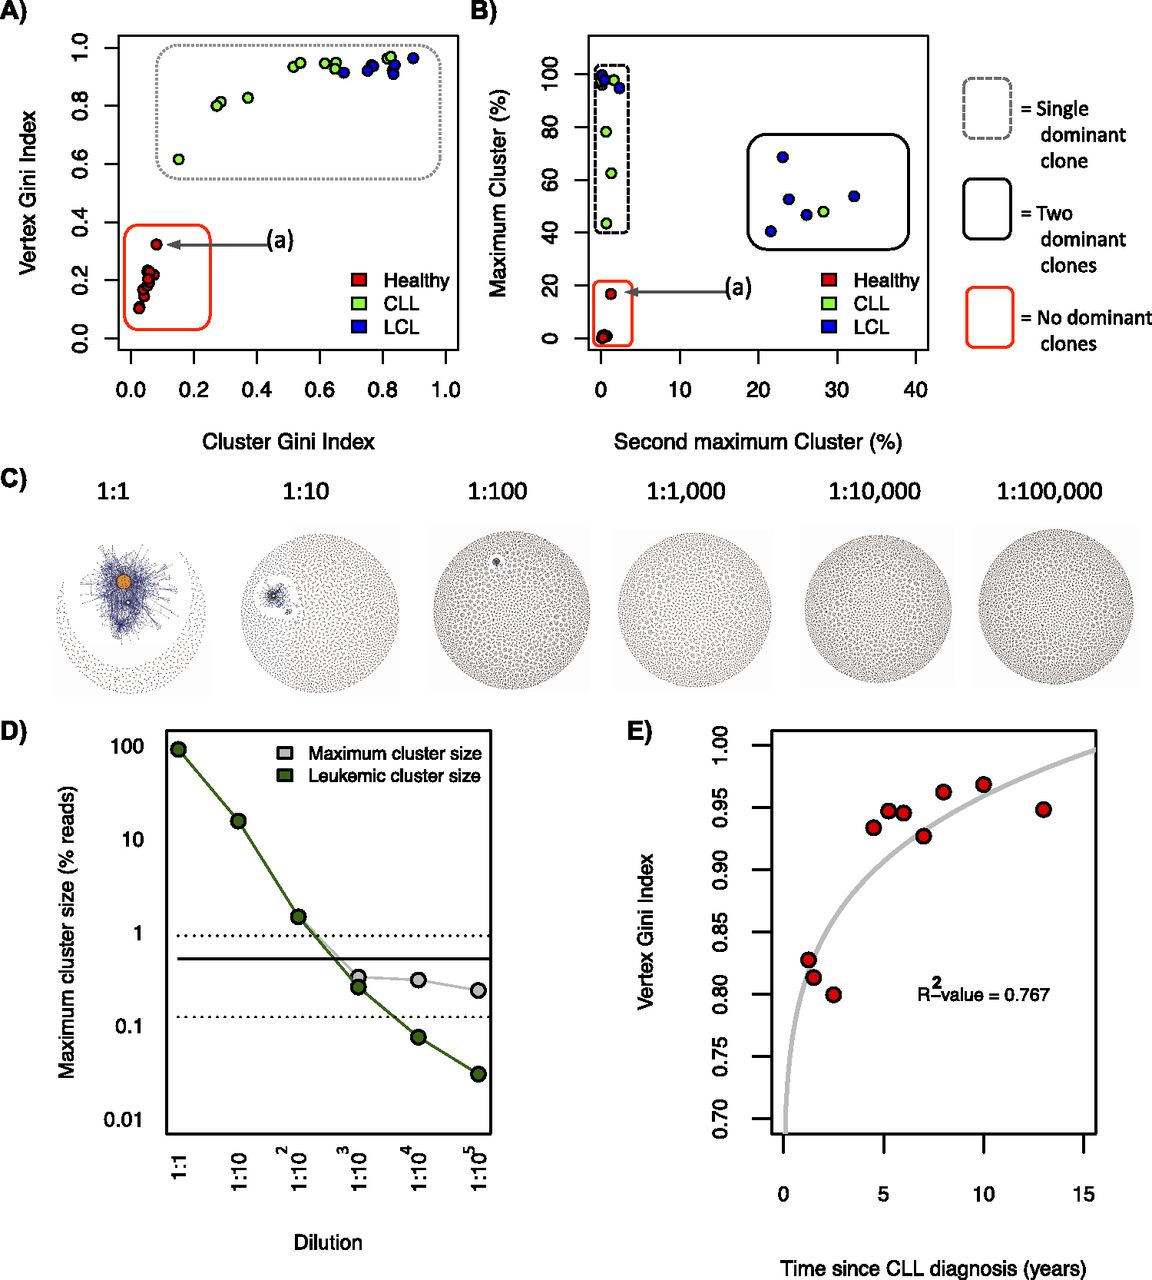
Measures differentiating between B-cell receptor populations. (A) Cluster Gini Index plotted against vertex Gini Index for 13 healthy individual samples, 11 chronic lymphocytic leukemia (CLL), and eight human lymphoblastoid cell line (LCL) samples. Point (a) corresponds with healthy individual 10. The red box and gray dashed box distinguish between the regions occupied between diverse and clonal populations, respectively. (B) The second maximum cluster sizes plotted against the maximum cluster sizes. The red, gray-dashed, and black solid boxes distinguish between the regions occupied between unexpanded populations, monoclonal expanded populations, and biclonally expanded populations, respectively. (C) B-cell receptor networks for the titration of a chronic lymphocytic leukemia clonal sample into healthy peripheral blood from the data set from Boyd et al. (2009), and (D) the corresponding number of reads corresponding to the leukemic clone (green) and the maximum cluster size of each dilution (gray). The solid horizontal line shows the mean maximum cluster size for healthy individuals from this data set (0.52% of total reads), and the dashed horizontal lines show the mean ±SD of maximum cluster size for healthy individuals for this data set. (E) Correlation between the Gini Index and the length of time since chronic lymphocytic leukemia (CLL) diagnosis for each patient in our data set, with corresponding R2-value.


