
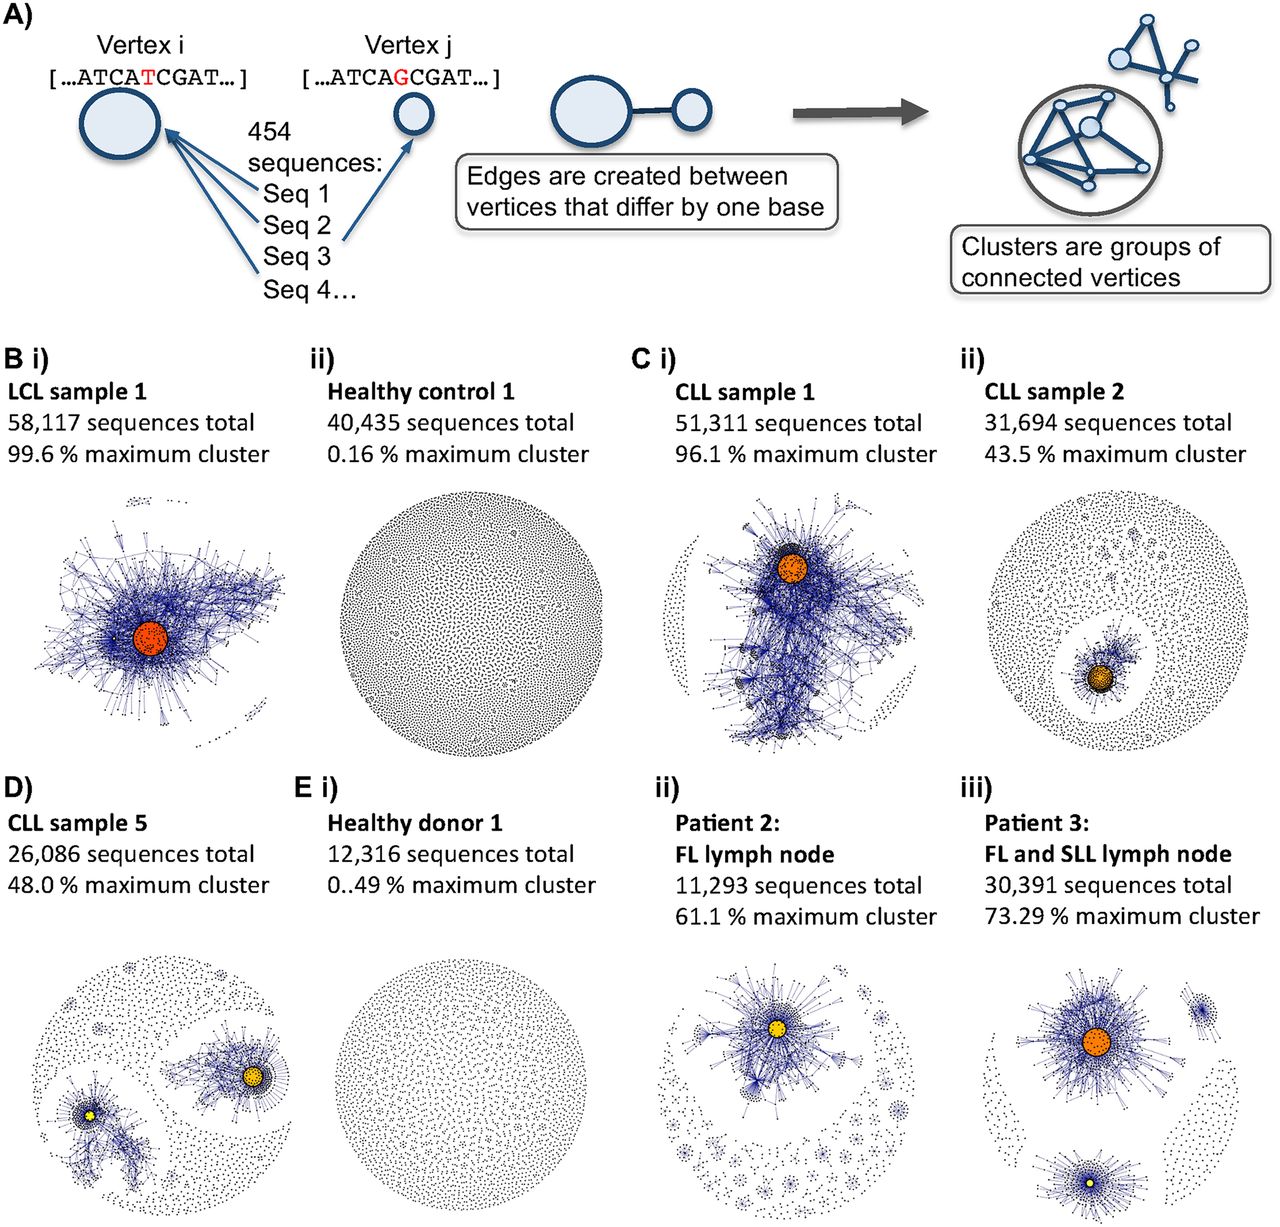
B-cell receptor repertoires from different samples. (A) Schematic diagram showing the method by which the sequencing networks are generated: Each vertex represents a unique sequence, where the relative size of the vertex is proportional to the number of 454 sequencing reads that were identical to the vertex sequence. Edges are created between vertices that differ by one base (indel or substitution). The vertex colors correspond to the relative abundance of the corresponding sequences, where red, orange, and yellow indicates observation of a sequence in >90%, between 40%–90%, and <40% of the reads in the sample, respectively. (B) Comparison of BCR sequence networks between (i) a typical LCL sample and (ii) a typical healthy individual. (C) BCR sequence networks of CLL patients with (i) extensive clonal enlargement and (ii) limited clonal expansion. (D) BCR sequence networks of CLL patient 5 showing expansion of two dominant clusters. (E) Networks generated from sequencing data set from Boyd et al. (2009) of (i) healthy donor 1, (ii) patient 2 with follicular lymphoma (FL), and (iii) patient 3 with FL and small lymphocytic lymphoma (SLL).


