
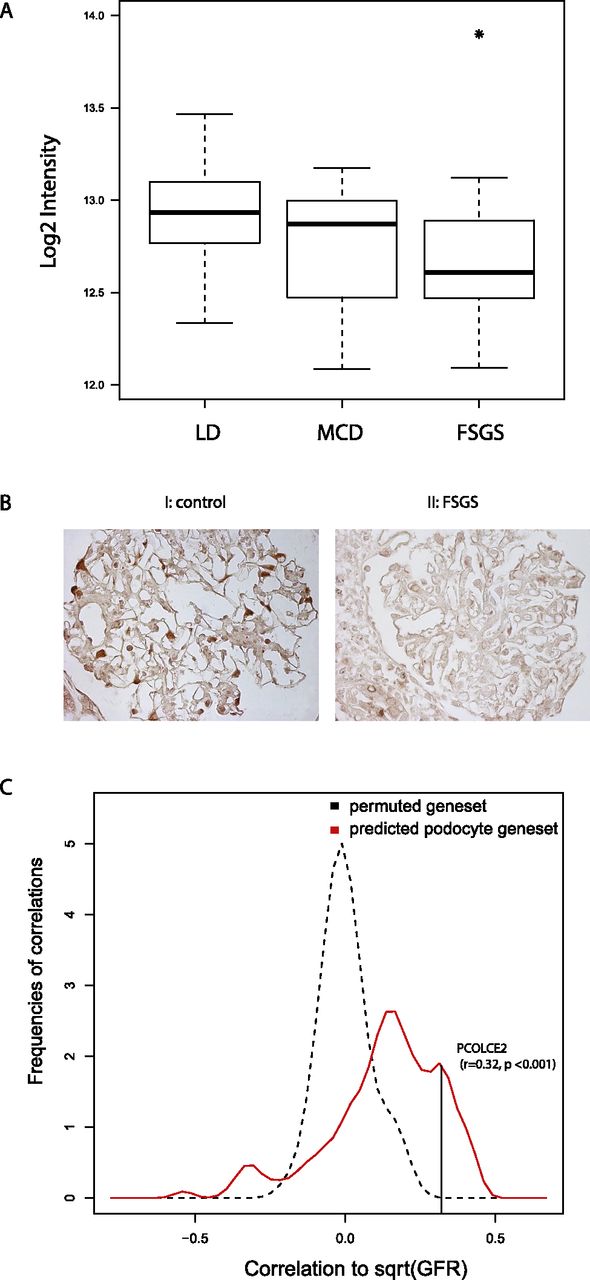
Regulation of predicted podocyte-specific gene set in human disease. (A) Box-and-whisker plot of glomerular mRNA expression of PCOLCE2 in biopsies from living donor controls (LD, n = 35), minimal change disease (MCD) patients (n = 12), and focal segmental glomerulosclerosis (FSGS) patients (n = 19). Asterisk denotes a significant differential expression (p < 0.05). (B) IHC staining of PCOLCE2 on kidney biopsies from controls (I) and FSGS patients (II). In comparison with control kidneys, PCOLCE2 signal disappears in FSGS patients. Images shown are the representative images in the glomerulus of controls (n = 5) and FSGS patients (n = 8). (C) Density plot of the association (Pearson correlation, x-axis) of the 136 predicted podocyte-specific genes (red) with renal function as quantified by GFR value, compared with density plot of repeatedly (100 times) randomized gene expression–GFR associations (black). The randomized set shows a distribution centered on zero (meaning no correlation with GFR), whereas the podocyte-specific genes show a skewed distribution toward positive correlation, indicating reduced gene expression is associated with impaired renal function. Correlation with GFR of the 136 transcripts across all renal diseases analyzed was significantly enriched compared with the permuted sample (p < 0.01). Black line indicates the correlation of PCOLCE2 mRNA level with GFR.


