
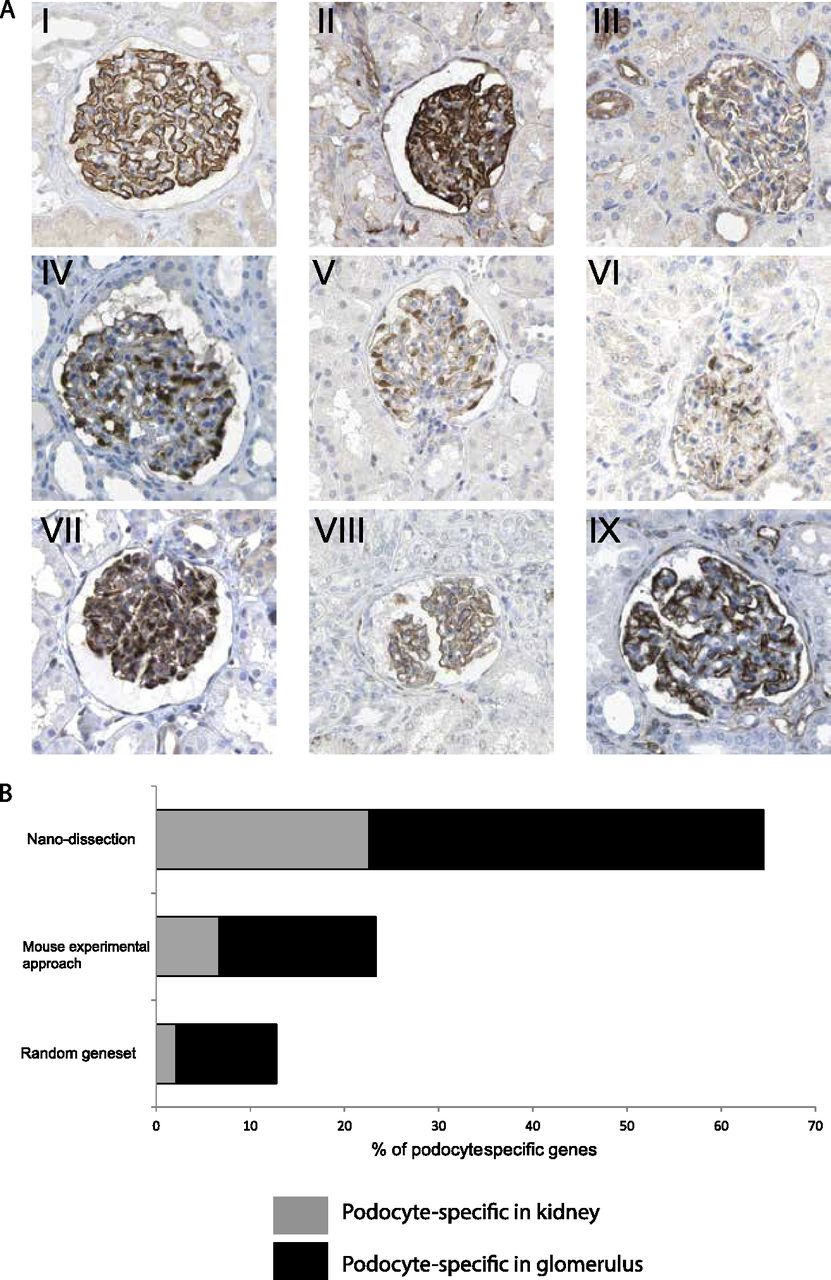
Evaluation of podocyte-specific genes based on qualified Human Protein Atlas (HPA) staining images. (A) HPA images demonstrate podocyte-specific pattern of positive standard markers and predicted genes. Staining pattern of positive standard markers: podocyte-specific in kidney (I): nephrin (NPHS1) and podocyte-specific in glomerulus: (II) SYNPO and (III) CD2AP. Exemplary staining patterns for de novo nanodissection predicted proteins (IV–IX): (IV) FGF1; (V) ARHGAP28; (VI) PRKAR2B; (VII) PCOLCE2; (VIII) GJA1; and (IX) ZDHHC6. (B) HPA-based distribution intrarenal protein staining pattern in random gene set, nanodissection-identified gene set, and the murine experimental approach-derived gene set: The in silico nanodissection approach (65%) significantly outperforms a random set of genes (12%) and the ex vivo murine experimental approach (23%) for identifying podocyte-specific genes. Gray bars show the proportion of genes with exclusively podoctye-specific staining within the kidney, and black bars show the proportion of genes with exclusively podocyte-specific staining within the glomerulus.


