
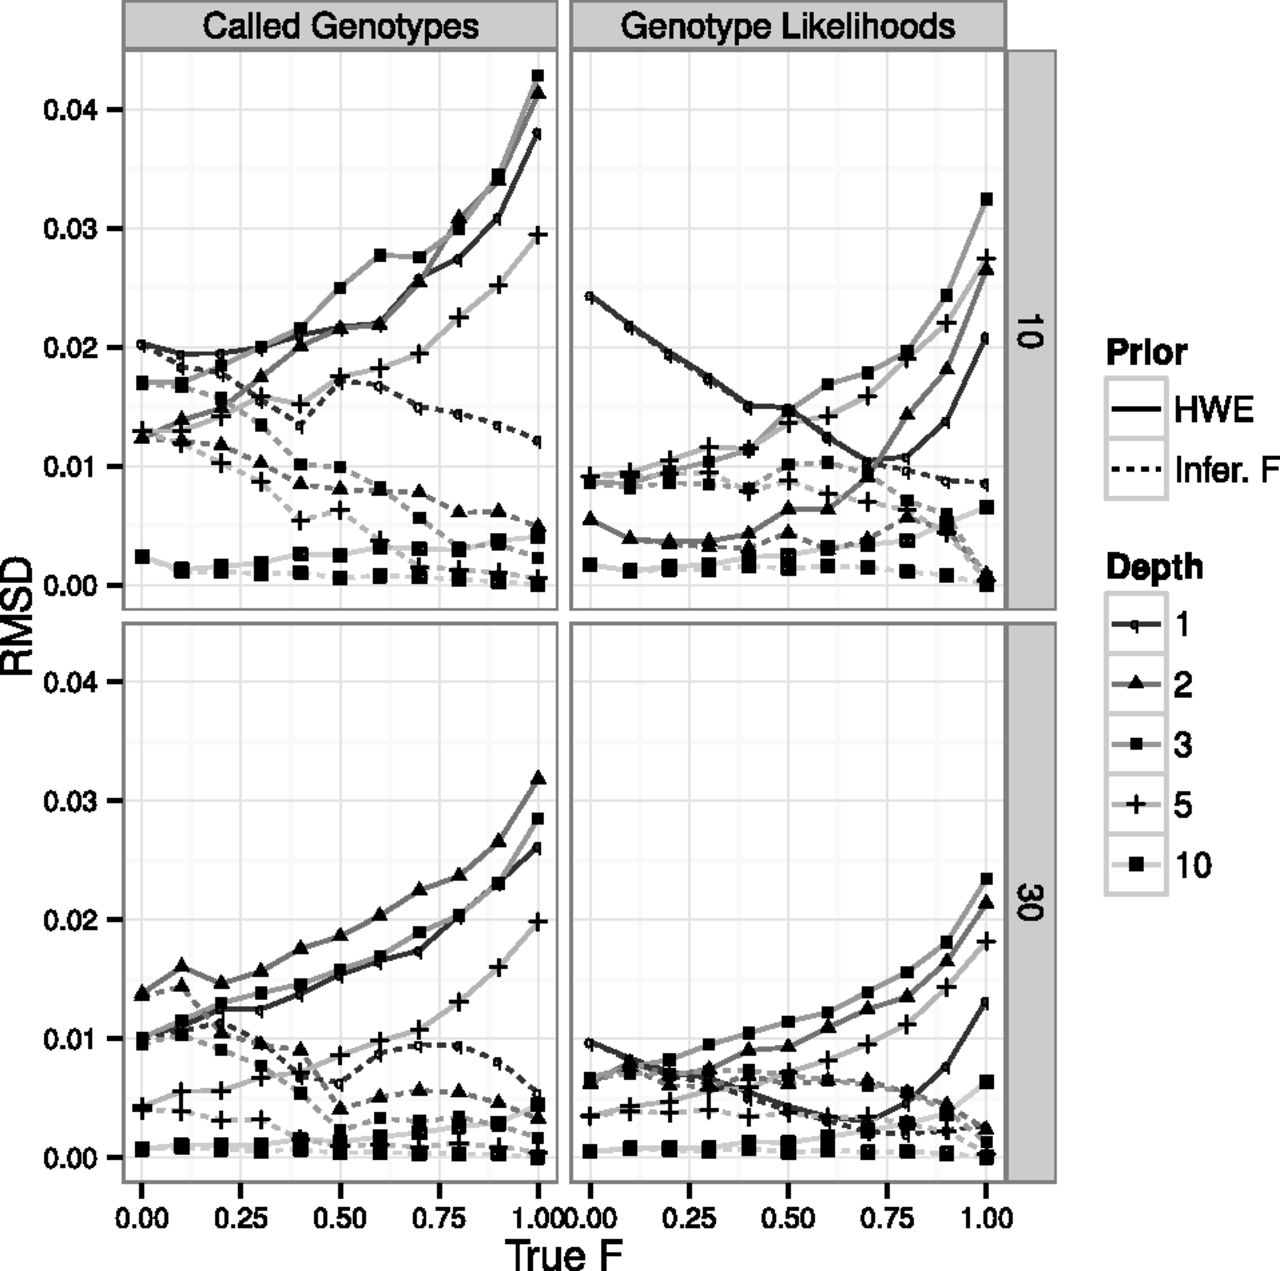
Figure 3.
Effect of the inbreeding coefficient on SFS estimation. Performance of SFS estimation from called genotypes (left column) and the Nielsen et al. (2012) method from GL and assuming inbreeding (right column), on a sample size of 10 (first row) and 30 (second row) individuals and 10,000 variable sites simulated with a 0.5% error rate. Line styles and symbols represent different simulated sequencing coverages. Line types depict the level of inbreeding assumed in the priors: F = 0 (HWE; filled) or inferred value of F (Infer. F; large dashes).


