
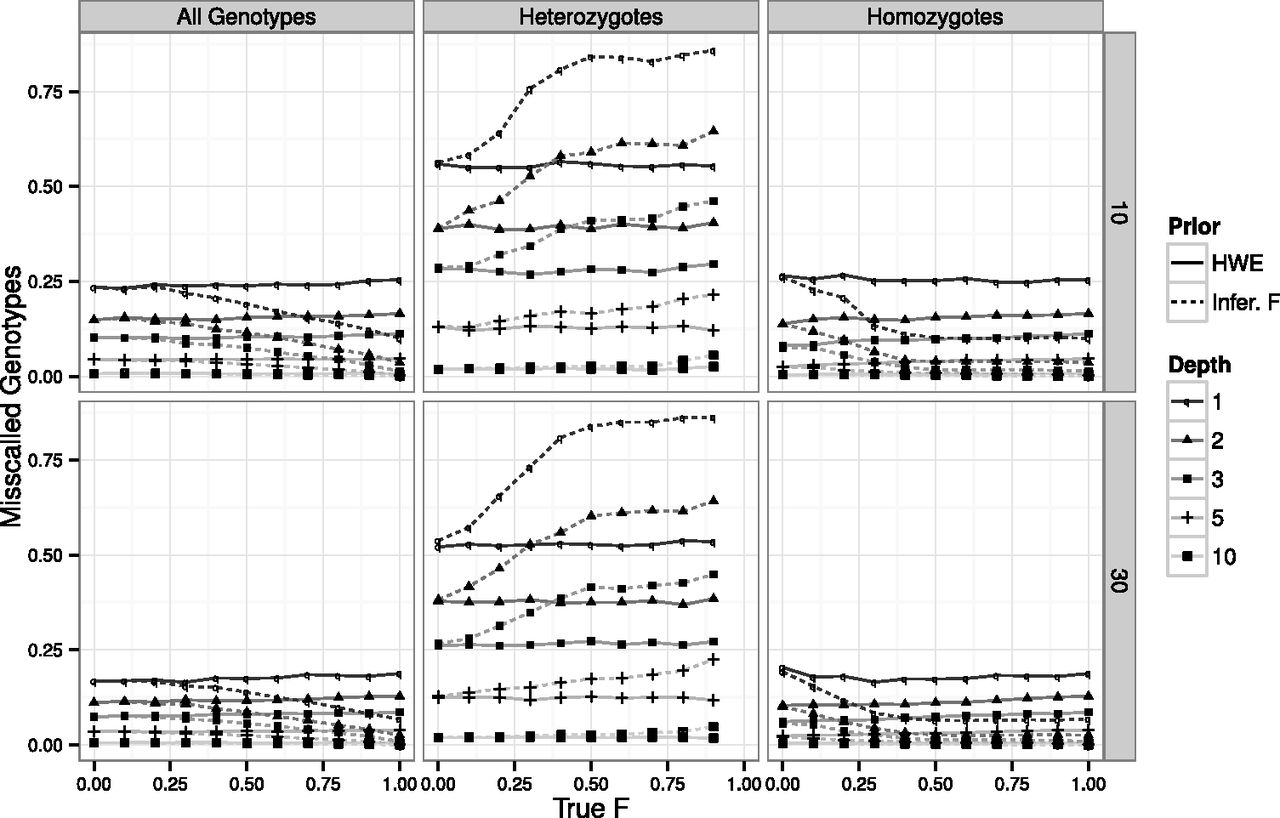
Figure 2.
Effect of the inbreeding coefficient on genotype calling. Performance of genotype calling globally (left column), on just heterozygous genotypes (center column) and just homozygous genotypes (right column), on a sample size of 10 (first row) and 30 (second row) individuals and 10,000 variable sites simulated with a 0.5% error rate. Line styles and symbols represent different simulated sequencing coverages. Line types represent the level of inbreeding assumed in the priors: F = 0 (HWE; filled) and inferred value of F (Infer. F; large dashes). Missing F = 1 values reflect the absence of heterozygous genotypes on a totally inbred sample.


