
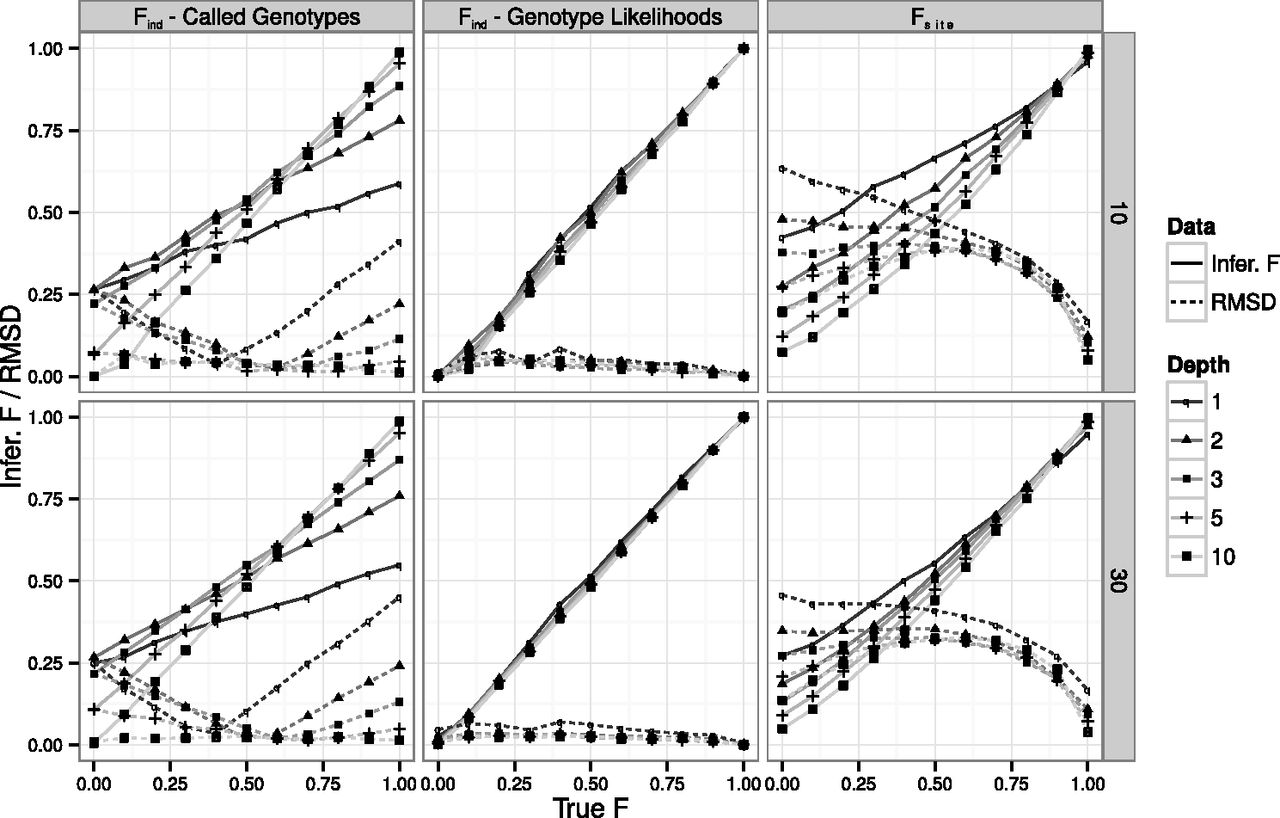
Figure 1.
Estimation of inbreeding coefficients. Performance of the EM method to infer Find from called genotypes (left column), Find from genotype likelihoods (center column), and Fsite (right column), for a sample size of 10 (first row) and 30 (second row) individuals and 10,000 variable sites simulated with a 0.5% error rate. Line styles and symbols represent different simulated sequencing coverages. Filled lines represent the inferred value for each simulated scenario (Infer. F), while dotted lines represent its RMSD.


