
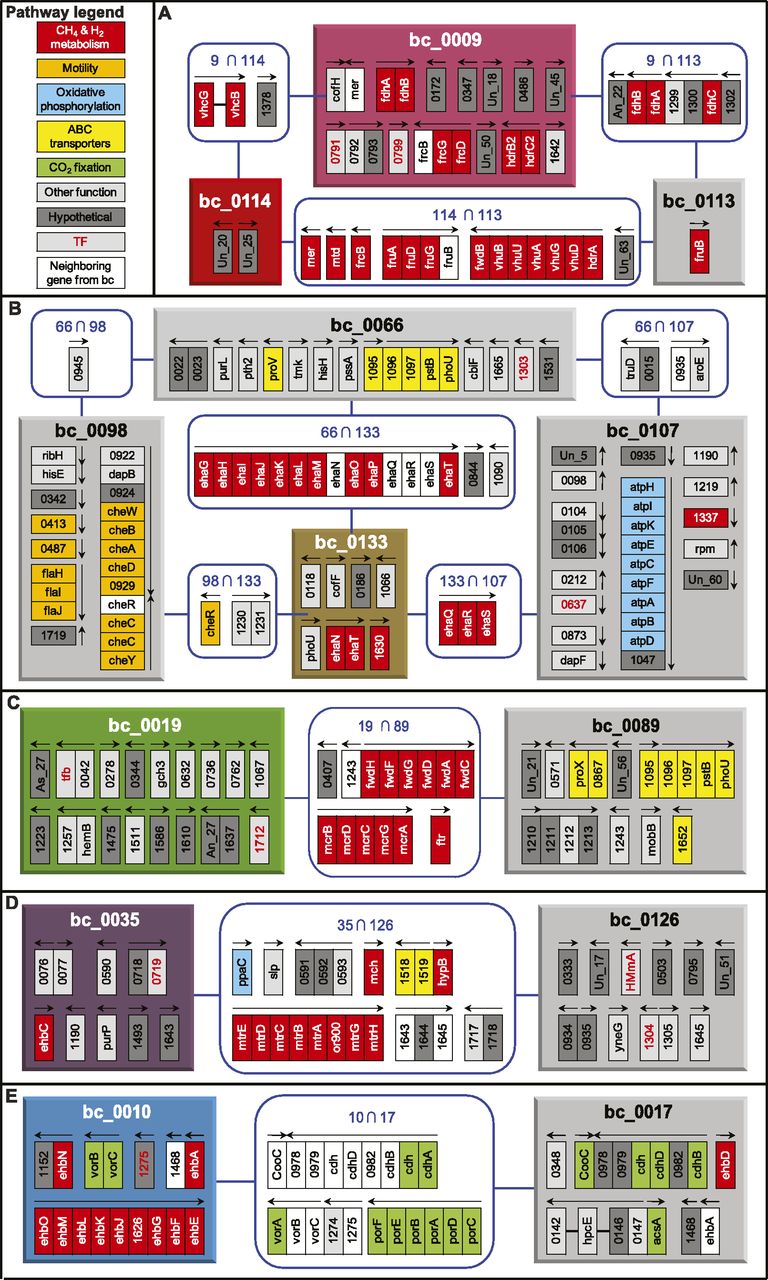
Biclusters related to the methanogenesis. Each panel shows methanogenesis-related bicluster(s) and associated biclusters.
(A) bc_0009 and bc_0114, (B) bc_0133, (C) bc_0019, (D) bc_0035, and (E) bc_0010. Colored boxes denote biclusters that are related to the methanogenesis as shown in Figure 2 and Supplemental Figure S2 (same color scheme). Biclusters that share three or more genes with methanogenesis-related biclusters
are linked to these biclusters for identifying functional associations and are shown as gray-colored boxes. Each rectangle
inside the bicluster boxes indicates member genes. Blue rounded squares of “A  B” show member genes common in the biclusters of A and B. Genes are colored according to their category from KEGG pathways—methane and hydrogen metabolism (red), motility (amber),
oxidative phosphorylation (baby blue), ABC transporters (yellow), CO2 fixation (green), other functions (gray), and hypothetical genes (dark gray). Genes that are adjacent to member genes of
a bicluster, but belong to the other connected bicluster, are in white. Transcription factor (TF) genes including putative
ones are shown in red lettering. Arrows above gene(s) indicate direction and span of transcription units determined in the previous study (Yoon et al. 2011). Un_XX means a transcript that did not match any protein sequence in the nr data set, and As_XX denotes a transcript antisense
to annotated genes. Detailed information of the biclusters can be found in Supplemental Figure S1 and Supplemental Table S5.
B” show member genes common in the biclusters of A and B. Genes are colored according to their category from KEGG pathways—methane and hydrogen metabolism (red), motility (amber),
oxidative phosphorylation (baby blue), ABC transporters (yellow), CO2 fixation (green), other functions (gray), and hypothetical genes (dark gray). Genes that are adjacent to member genes of
a bicluster, but belong to the other connected bicluster, are in white. Transcription factor (TF) genes including putative
ones are shown in red lettering. Arrows above gene(s) indicate direction and span of transcription units determined in the previous study (Yoon et al. 2011). Un_XX means a transcript that did not match any protein sequence in the nr data set, and As_XX denotes a transcript antisense
to annotated genes. Detailed information of the biclusters can be found in Supplemental Figure S1 and Supplemental Table S5.


