
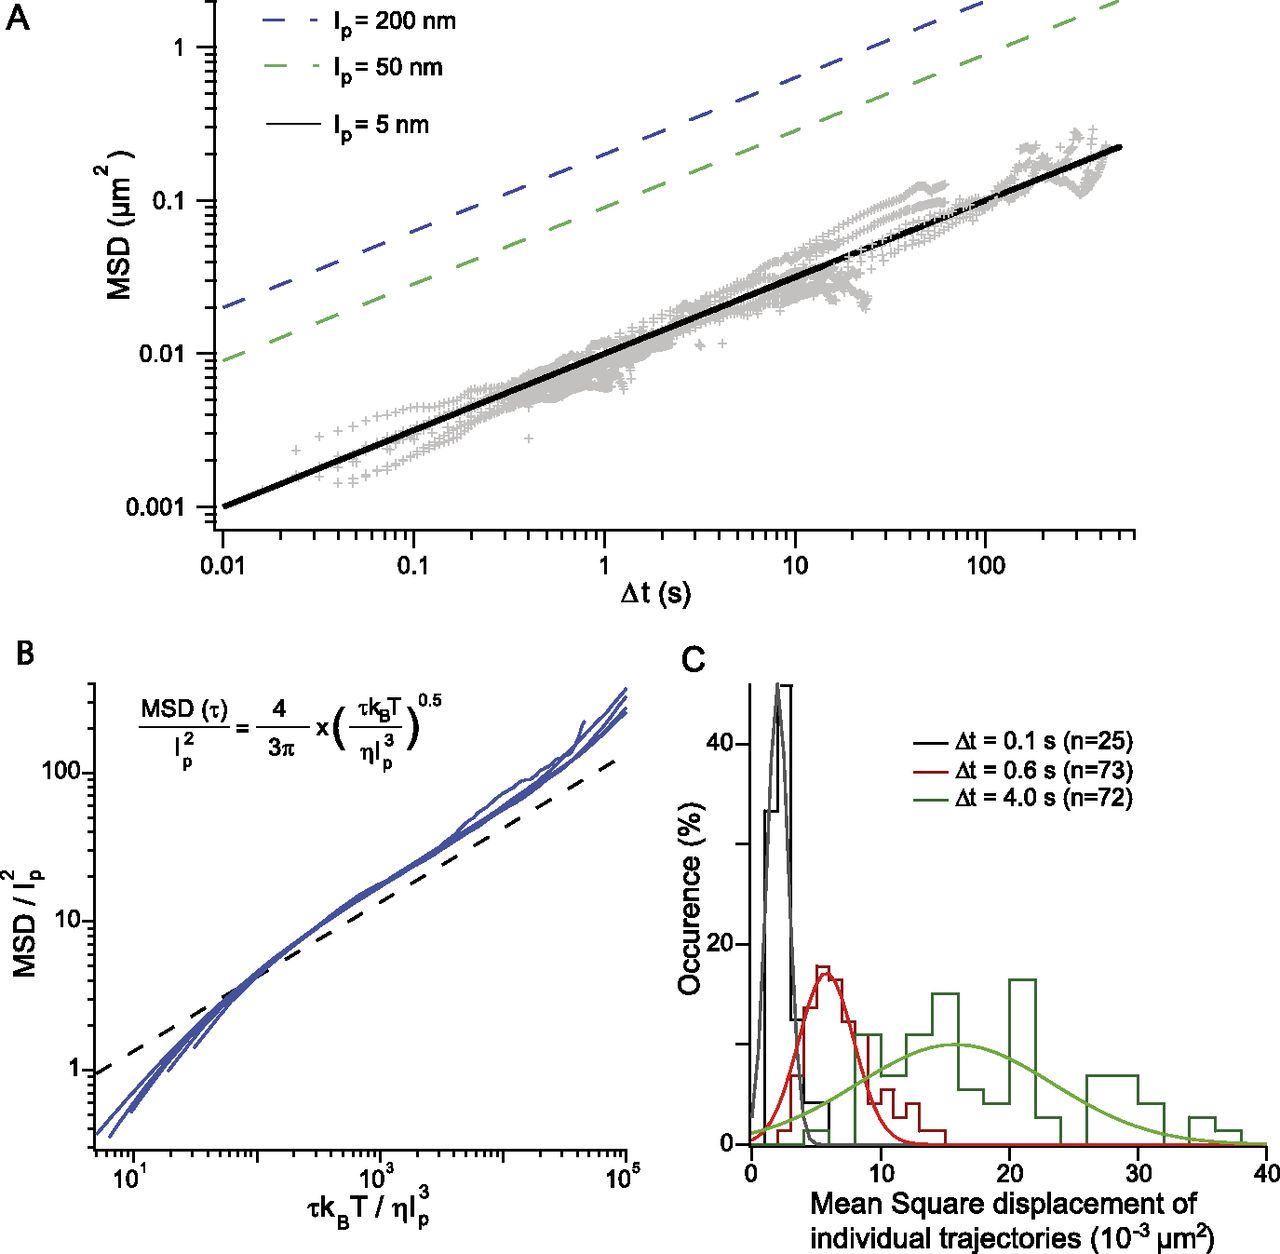
Assaying chromatin flexibility from MSD analysis. (A, gray) The MSD response plotted in Figure 2B is analyzed with the Rouse model for different values of the persistence length of 200, 50, and 5 nm, as specified in the
inset. The dynamics of chromosome loci are consistent with highly flexible chromatin. (B) Brownian dynamics simulations of an isolated chain containing 100 segments have been performed to confirm the relevance
of the Rouse model. Dimensionless variables are defined using lp and  as characteristic length and time scales; the MSD of a central monomer is plotted with different persistence lengths of 15,
30, 60, or 90 nm and for two different viscosities of 10−3 and 10−2 P (blue data sets). These data sets fall on a master curve, which follows the power law scaling of the analytical Rouse model:
The black dashed line is derived from Equation 2 using the dimensionless variables (see exact expression in inset). (C) The histogram of the average square displacement after 0.1, 0.6, and 4.0 sec is represented for ∼70 trajectories of a locus
at position 680 on chromosome XII, with a broad cell-to-cell variability within a single clone. The lines are Gaussian fits
and serve as guides to the eye.
as characteristic length and time scales; the MSD of a central monomer is plotted with different persistence lengths of 15,
30, 60, or 90 nm and for two different viscosities of 10−3 and 10−2 P (blue data sets). These data sets fall on a master curve, which follows the power law scaling of the analytical Rouse model:
The black dashed line is derived from Equation 2 using the dimensionless variables (see exact expression in inset). (C) The histogram of the average square displacement after 0.1, 0.6, and 4.0 sec is represented for ∼70 trajectories of a locus
at position 680 on chromosome XII, with a broad cell-to-cell variability within a single clone. The lines are Gaussian fits
and serve as guides to the eye.


