
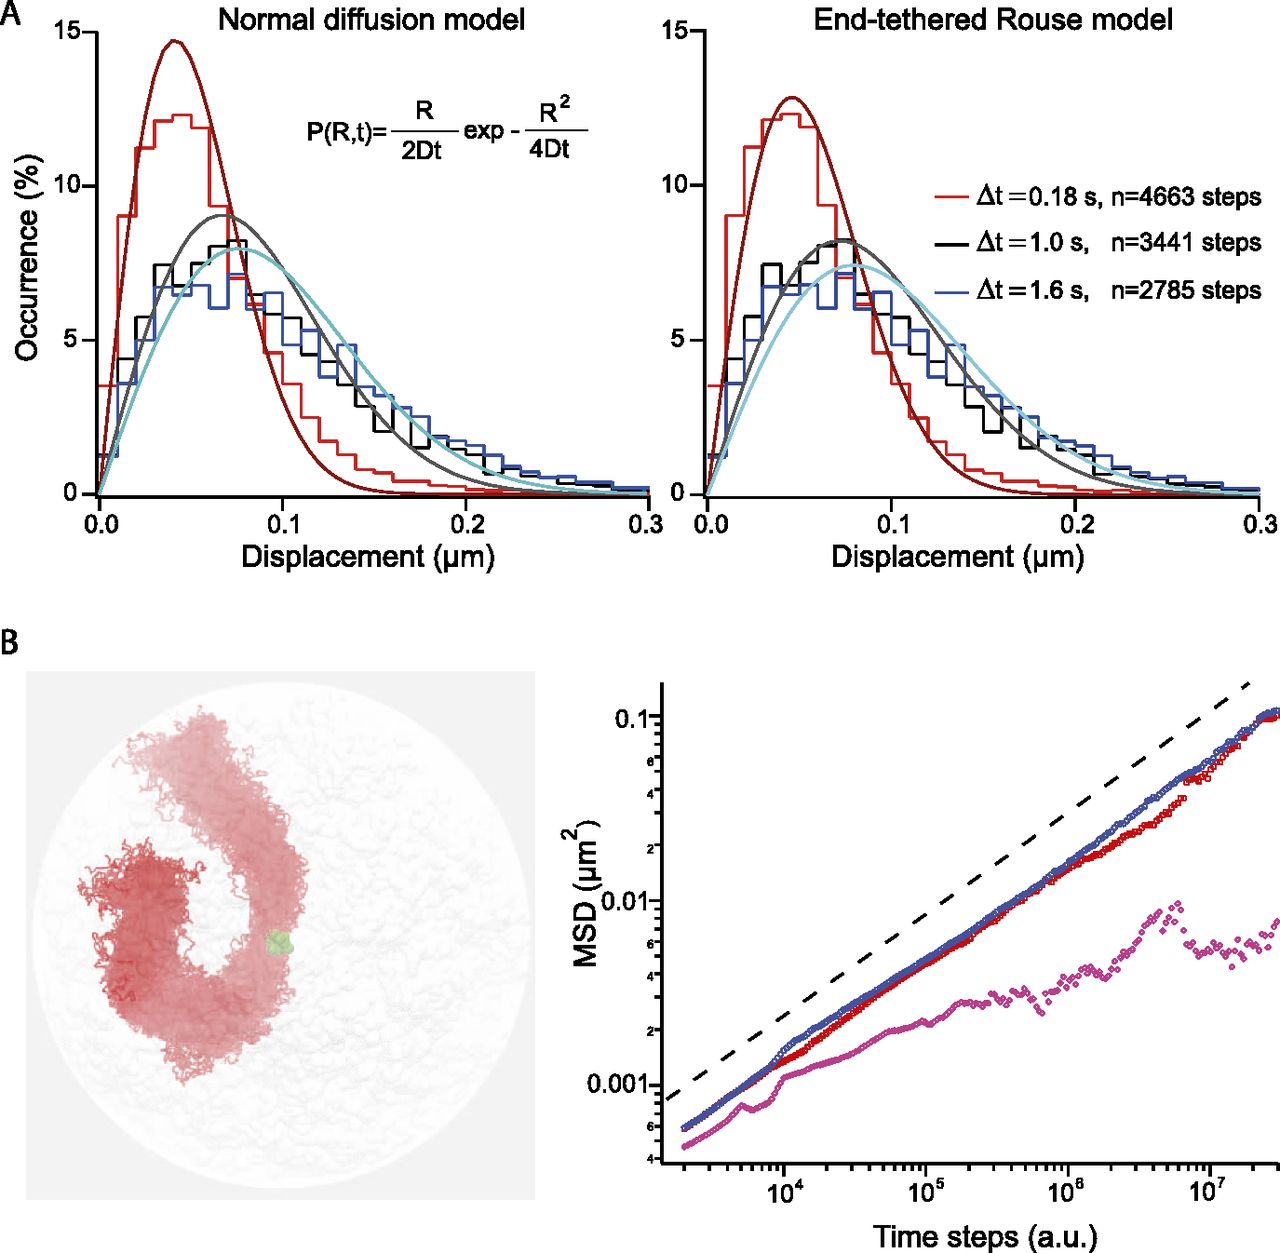
Rouse model for chromosome segmental dynamics. (A) The two graphs represent the step distribution functions measured for three different time intervals, which are represented by dashed lines in Figure 2A. The genomic position of the locus on chromosome XII is 240 kb, and the interframe interval of the acquisition is 59 msec. Note the deviation of the distributions toward longer displacements for increasing time lags, which is consistent with the progressive exploration of the nuclear volume. The three curves are fitted to a normal diffusion model (equation in the inset) or an end-tethered Rouse model (Eqs. 4, 5) (left and right panels, respectively). (B) Brownian dynamics simulation was implemented with polymer chains and in a realistic yeast nucleus using the nuclear conformation obtained by Hi-C as initial state (Duan et al. 2010). Chromosomes are tethered at their centromeres (green spheres) and free at their telomeres. The figure in the left panel represents the orthographic projection of 100 conformations of chromosome III in the course of one simulation of 106 time points. The polymer is elongated, and its diameter is ∼300 ± 50 nm. The MSD is computed for loci localized near the SPB, or at 200–400 nm and more than 400 nm from this anchor (purple, red, and blue data sets, respectively), showing that the response follows Rouse dynamics (black dashed line) provided that the locus is sufficiently distant from CEN.


