
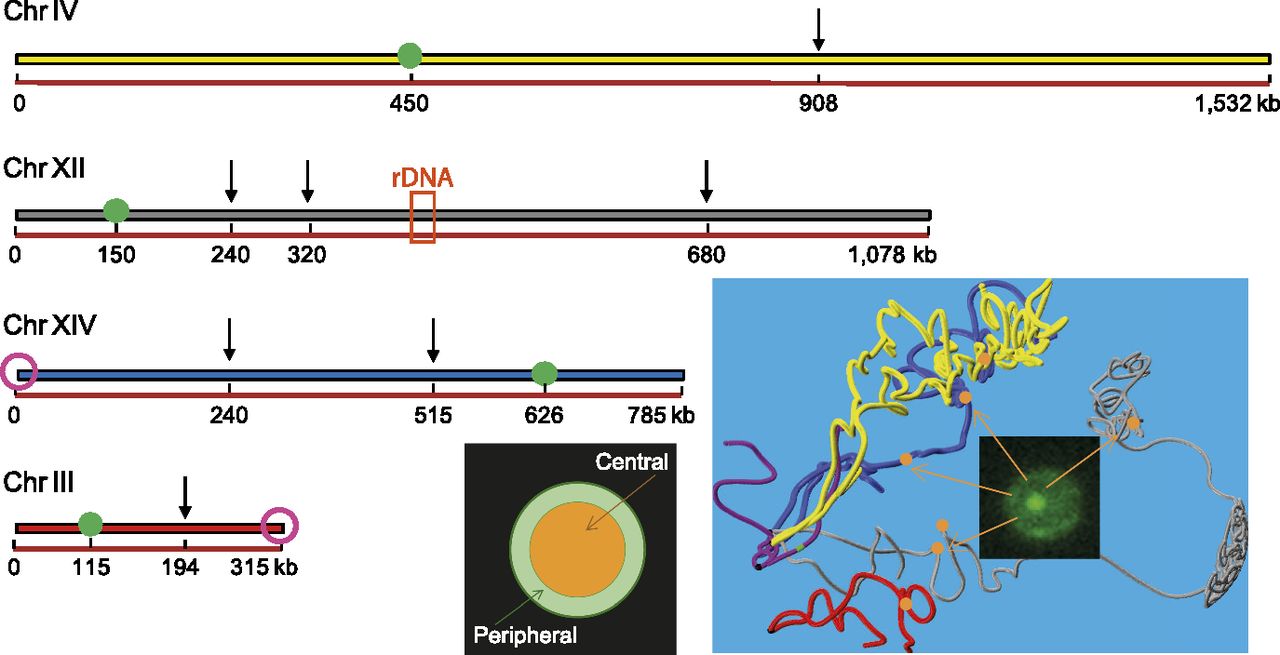
Collection of loci used to monitor chromosome spatio-temporal dynamics. Arrows indicate the genomic positions at which TetO or LacO repeats were inserted in four chromosomes. These loci are also represented by orange spheres on the yeast nuclear map obtained by Hi-C (Duan et al. 2010). The two purple circles represent the telomeres that were tracked with the same labeling technique, and the green circles correspond to the centromere. The orange box corresponds to the rDNA locus, which represents ∼1 Mb of ribosomal DNA. The preferred localization of these loci was scored using a subdivision of the nucleus into two regions of equal surface (orange and green for central and peripheral localizations, respectively).


