
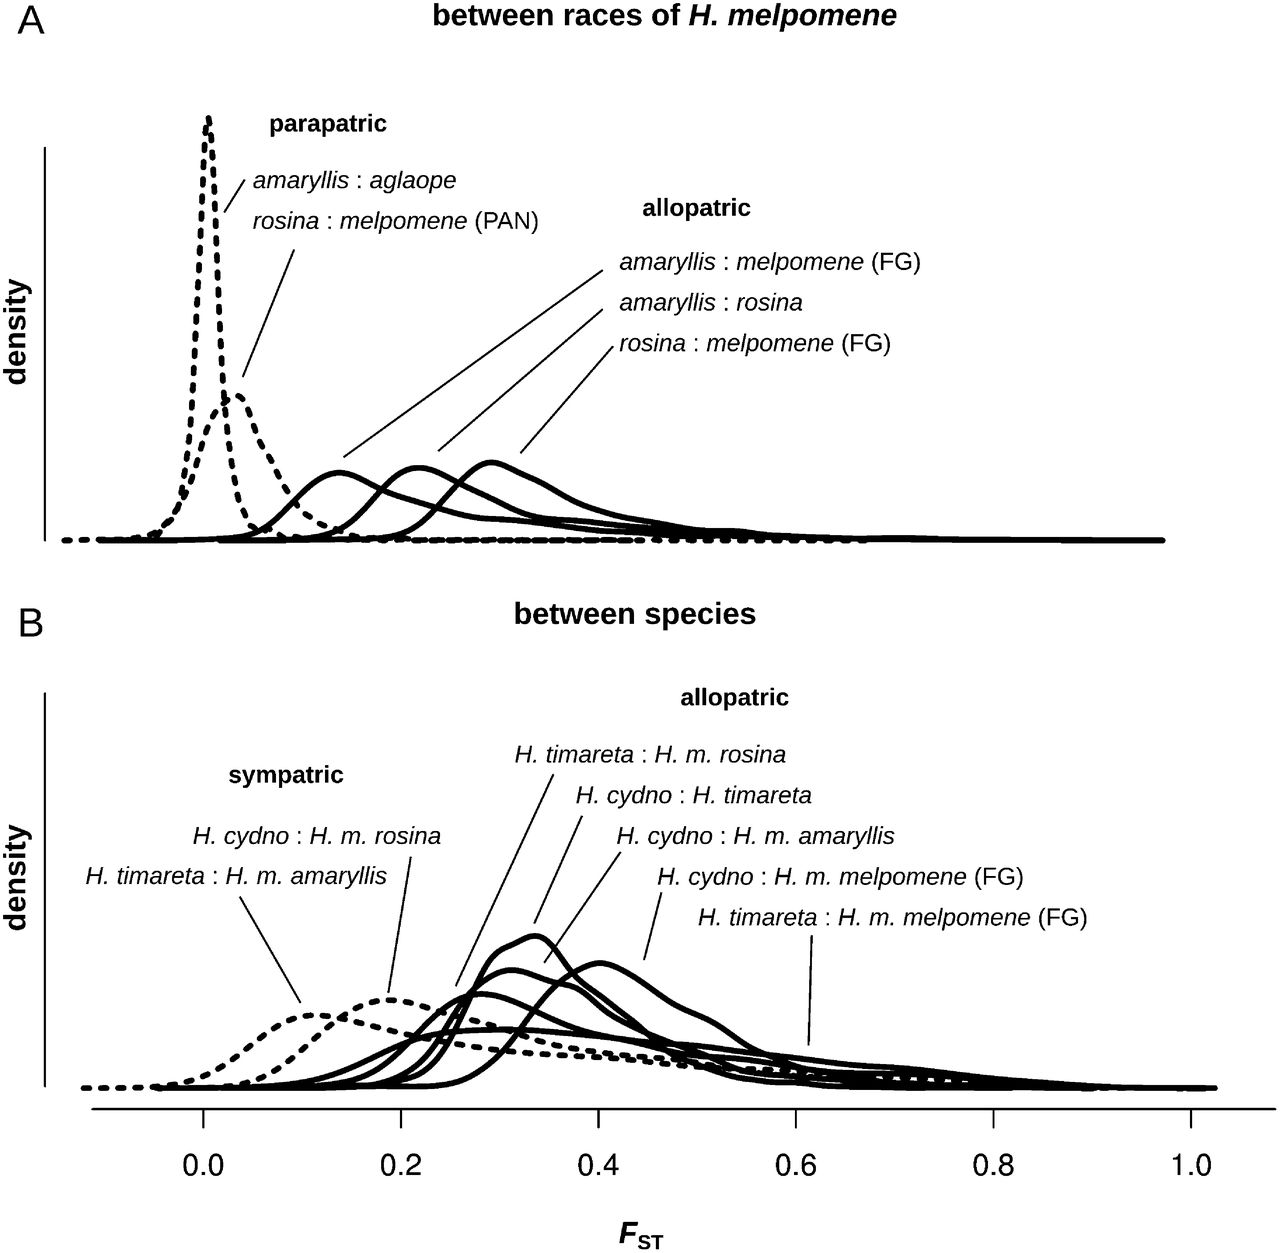
Figure 5.
Density plots of pairwise FST values for non-overlapping 100-kb windows. All pairwise comparisons, corresponding to the plots in Figure 4, between races of H. melpomene (A), and between species (B).
(Downloading may take up to 30 seconds. If the slide opens in your browser, select File -> Save As to save it.)
Click on image to view larger version.
Density plots of pairwise FST values for non-overlapping 100-kb windows. All pairwise comparisons, corresponding to the plots in Figure 4, between races of H. melpomene (A), and between species (B).
 CiteULike
 Delicious
 Digg
Digg Facebook
 Google+
 Reddit
 Twitter
