
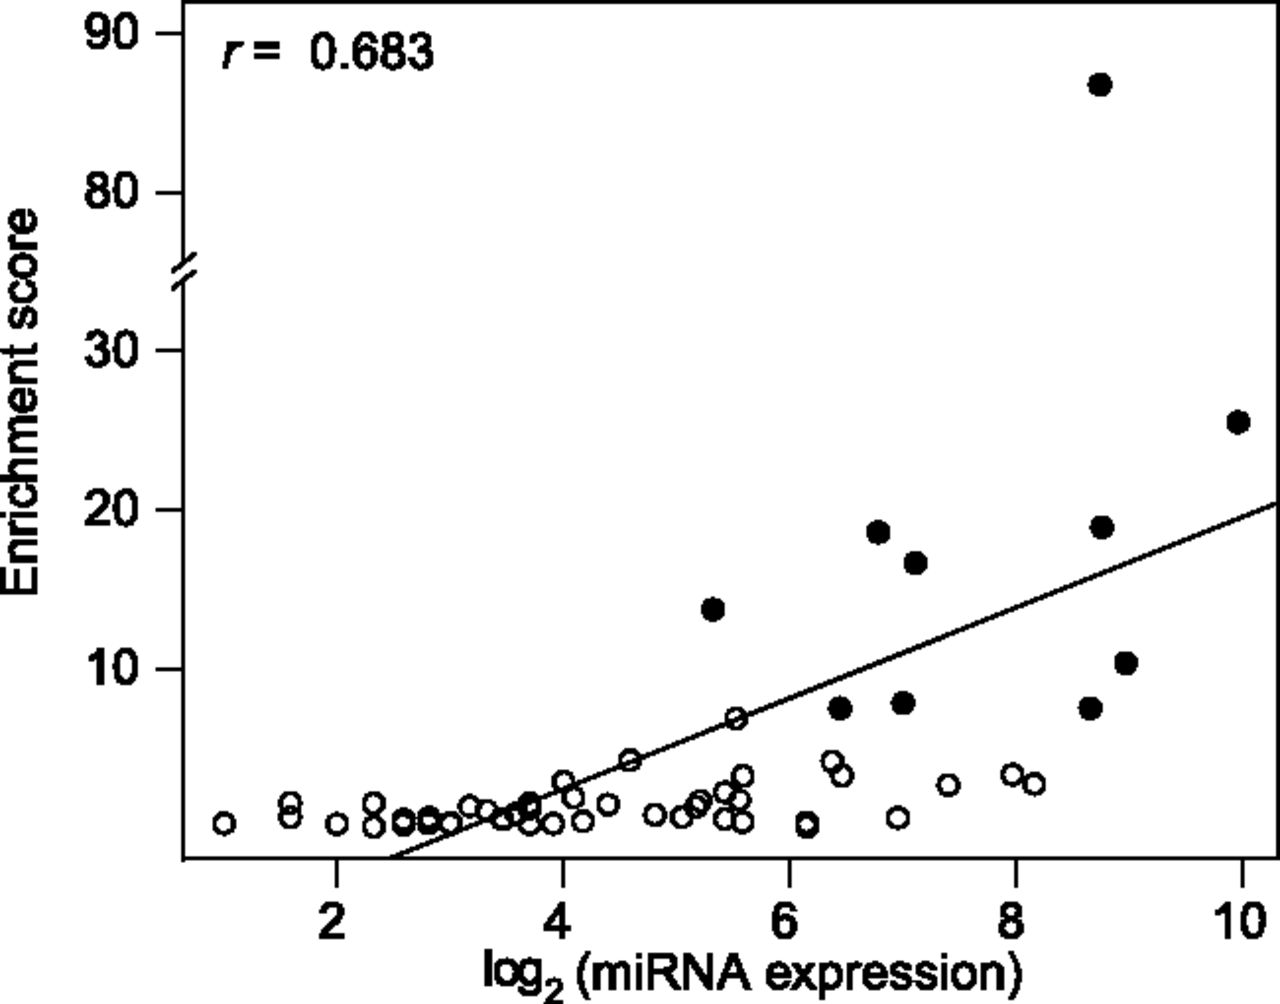
Figure 1.
The relationship between the degree of target site enrichment in the CLIP data and the expression level of the corresponding miRNAs. The latter is presented as the log2 of the sum of all reads of relevant miRNAs. The top 10 enrichment scores are marked with a black solid dot.


