
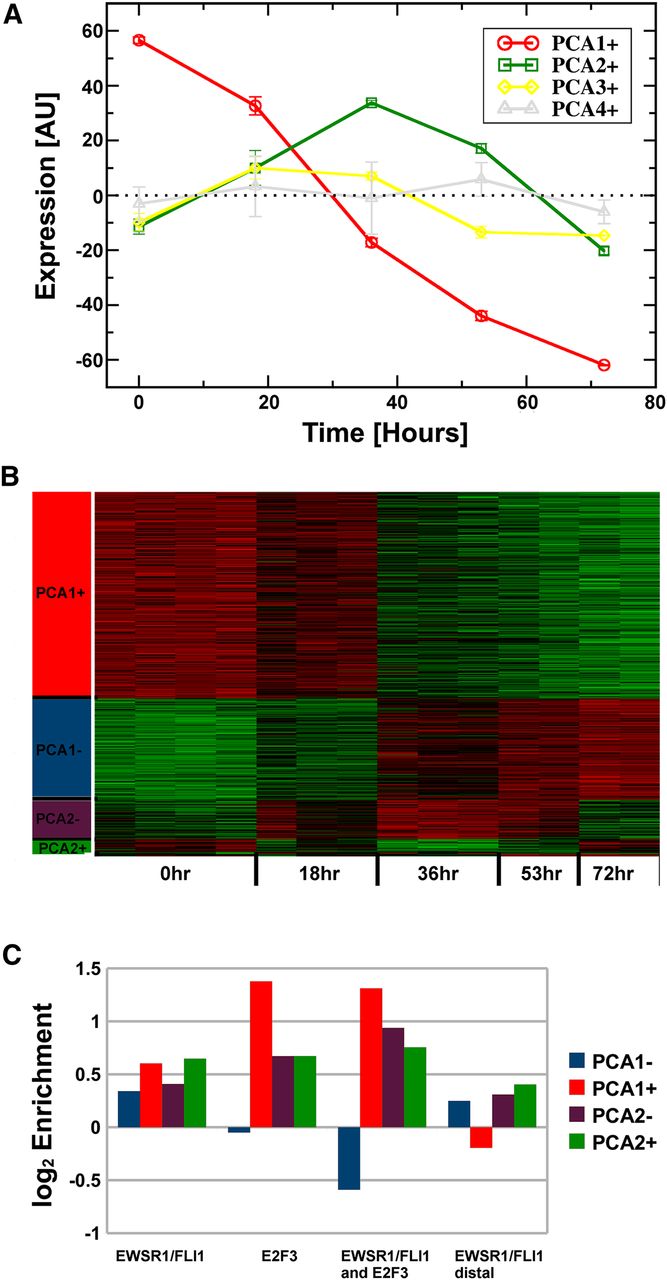
Transcription factor binding and gene expression changes in response to shRNA-induced knockdown of EWSR1/FLI1. (A) The first four principal components of the knockdown-induced expression changes. Each component represents one coherent, dominant pattern of expression changes. Only the first three components show a significant nonzero signal; thus, only these three components were used in the subsequent analysis. (B) Heatmap of expression level changes of genes significantly (r > 0.8) correlated (+) and anti-correlated (−) with principal components 1 and 2. Due to their relatively low number, genes correlated with PCA3 are not visible in this diagram. (C) Compared with a flat background model, E2F3 and EWSR1/FLI1 binding regions are enriched adjacent to genes with expression changes correlated to the two largest principal components. Both factors overlap, and this association is generally stronger, with the notable exception of PCA1−: Colocalization of both factors is underrepresented among genes rapidly up-regulated in response to EWSR1/FLI1 knockdown. Also, EWSR1/FLI1 binding in distal regions is underrepresented in the group of responders following PCA1+.


