
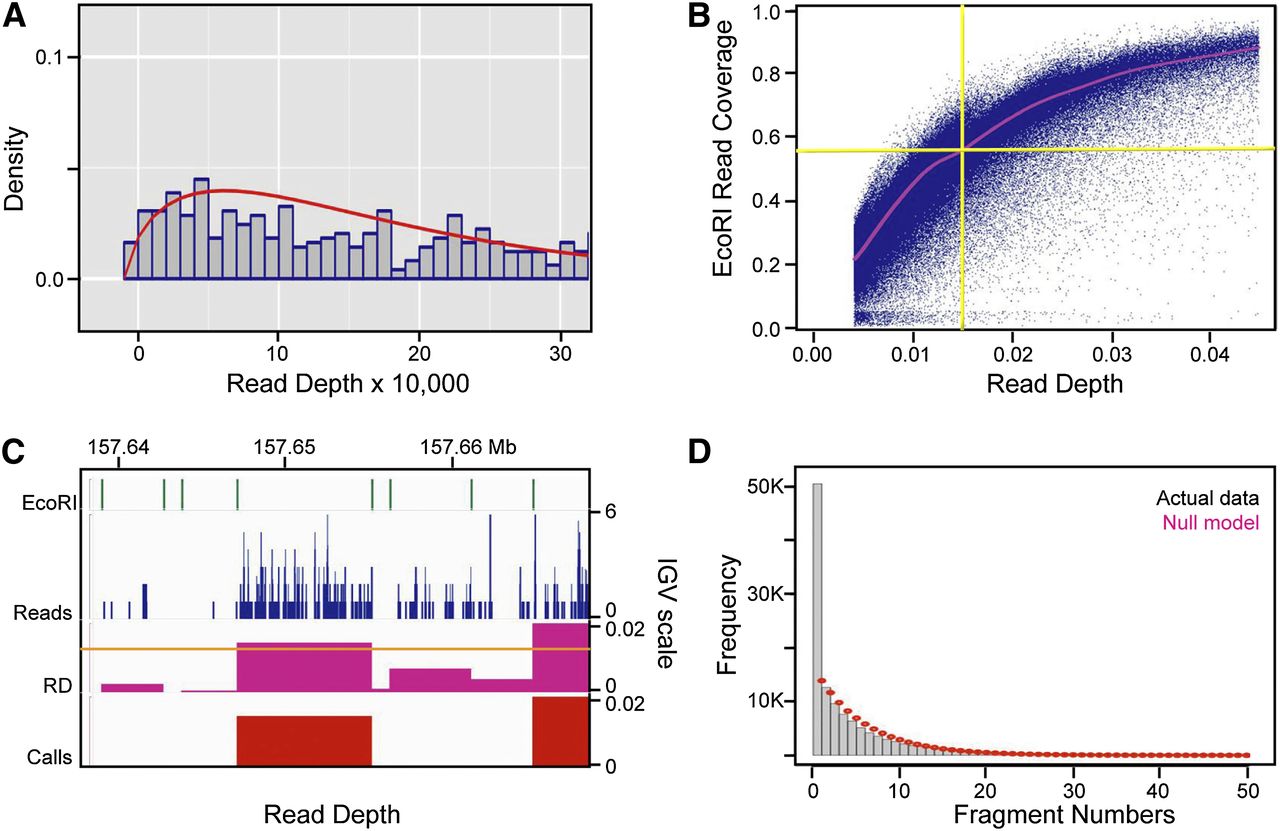
Establishing and validating the read-depth (RD) cutoff value and the negative fragment exclusion rule for zones. (A) Distribution of read depths multiplied by 10,000 and rounded to the nearest integer (gray bins), and the negative binomial
distribution (red) fitted to the lowest RDs in the sequencing data. The fitted negative binomial distribution was used to
calculate P-values and false discovery rates (FDRs) for every EcoRI fragment in the genome. (B) Scatter plot of the fraction of each EcoRI fragment that is covered by reads (y-axis) versus EcoRI RD for all EcoRI fragments. The red line represents a moving average calculated using the loess package
in R (Becker et al. 1988). As can be seen, the 0.0144 RD cutoff applied to the combined sequencing data sets corresponds to ∼60% coverage of EcoRI
fragments on average. (C) IGV screen shot of EcoRI fragment boundaries, sequencing read profiles (blue), RDs calculated within EcoRI fragments (fuchsia),
and fragments that pass the 0.1% FDR cutoff value of 0.0144 (red). This 30-kb region highlights a typical fragment (left of center) whose RD just surpassed the cutoff, as well as the constrained RD pile-ups within EcoRI fragment boundaries. (D) Histogram of the number of negative EcoRI fragments between any two bubble-containing fragments in the genome (gray bins),
and the discrete distribution of the null model  after scaling (red dots). p is the probability (0.1599365) of finding a bubble-containing fragment in the genome and n is the number of negative fragments between two bubble-containing fragments (See Supplemental Methods for details). Based
on the ∼3.6-fold enrichment of actual data over that predicted by the null model for n = 1 (i.e., one negative fragment between two positive ones), a one-fragment joining rule was adopted wherein a “zone” was
defined as a cluster of adjacent bubble-containing EcoRI fragments, no two of which are separated by more than one negative
fragment.
after scaling (red dots). p is the probability (0.1599365) of finding a bubble-containing fragment in the genome and n is the number of negative fragments between two bubble-containing fragments (See Supplemental Methods for details). Based
on the ∼3.6-fold enrichment of actual data over that predicted by the null model for n = 1 (i.e., one negative fragment between two positive ones), a one-fragment joining rule was adopted wherein a “zone” was
defined as a cluster of adjacent bubble-containing EcoRI fragments, no two of which are separated by more than one negative
fragment.


