
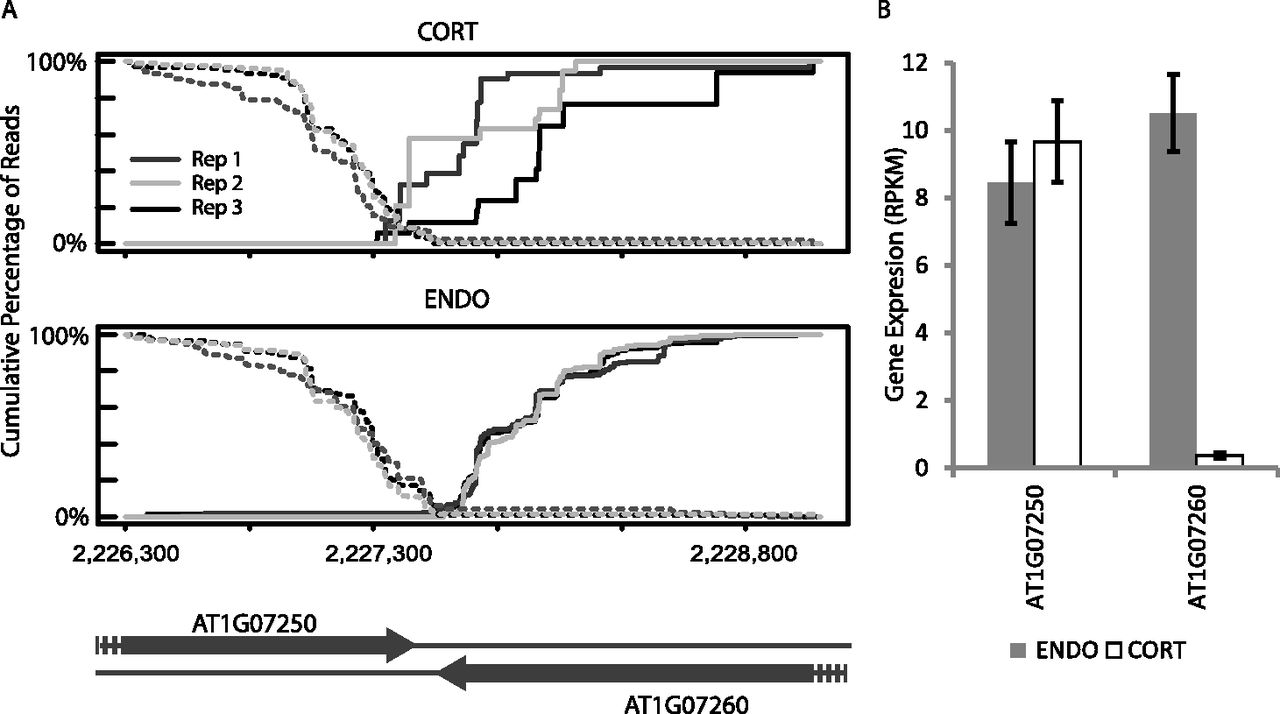
Figure 6.
Example of cell-type–specific expression of cis-NAT pairs. (A) Cumulative distribution of reads from the predicted cis-NAT pair of AT1G07250 and AT1G07260. The two annotated genes have an intergenic distance of 60 bp. Expression from cortex (CORT) and endodermis (ENDO) samples are both shown. The cumulative distributions show a visible overlapping between two genes in the CORT sample but not in the ENDO sample. (B) Gene expression levels of the two genes in two cell types. Bar plot shows the RPKM ± SEs of three biological replicates.


