
Figure 5.
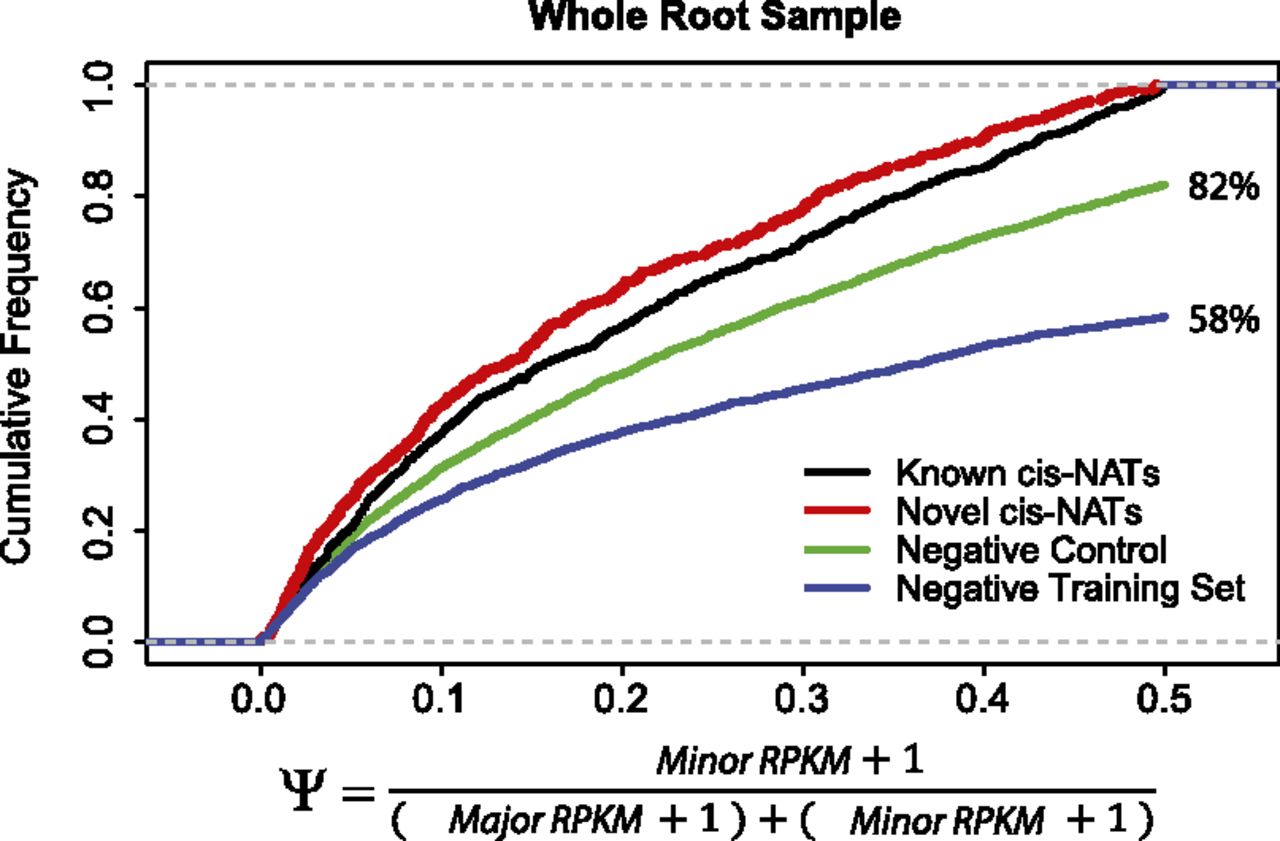
Cumulative frequency of minor gene fraction (Ψ). Numbers next to the green and blue curve show the percentage of gene pairs with Ψ less than 0.5.
(Downloading may take up to 30 seconds. If the slide opens in your browser, select File -> Save As to save it.)
Click on image to view larger version.
Cumulative frequency of minor gene fraction (Ψ). Numbers next to the green and blue curve show the percentage of gene pairs with Ψ less than 0.5.
 CiteULike
 Delicious
 Digg
Digg Facebook
 Google+
 Reddit
 Twitter
