
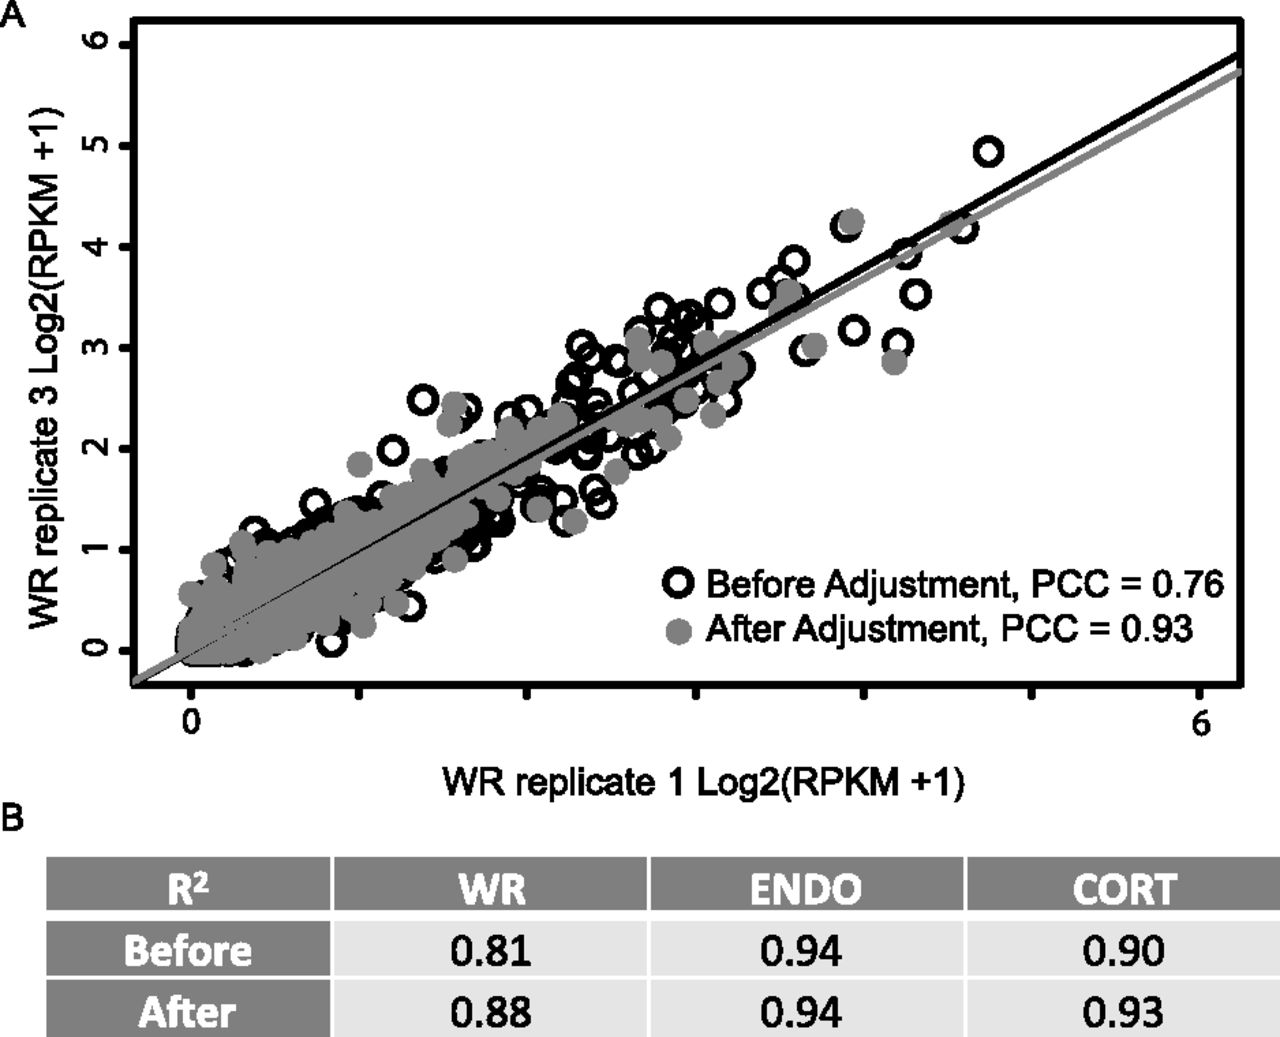
Figure 4.
Expression quantification of cis-NAT genes. (A) Scatter plot of gene expression levels of cis-NAT genes before and after adjustment for the protocol error rate. (PCC) Pearson correlation coefficient. (B) R2 of the multiple linear regressions between three biological replicates for each sample. This R2 is the multivariate equivalent of the R2 for simple pairwise comparison.


