
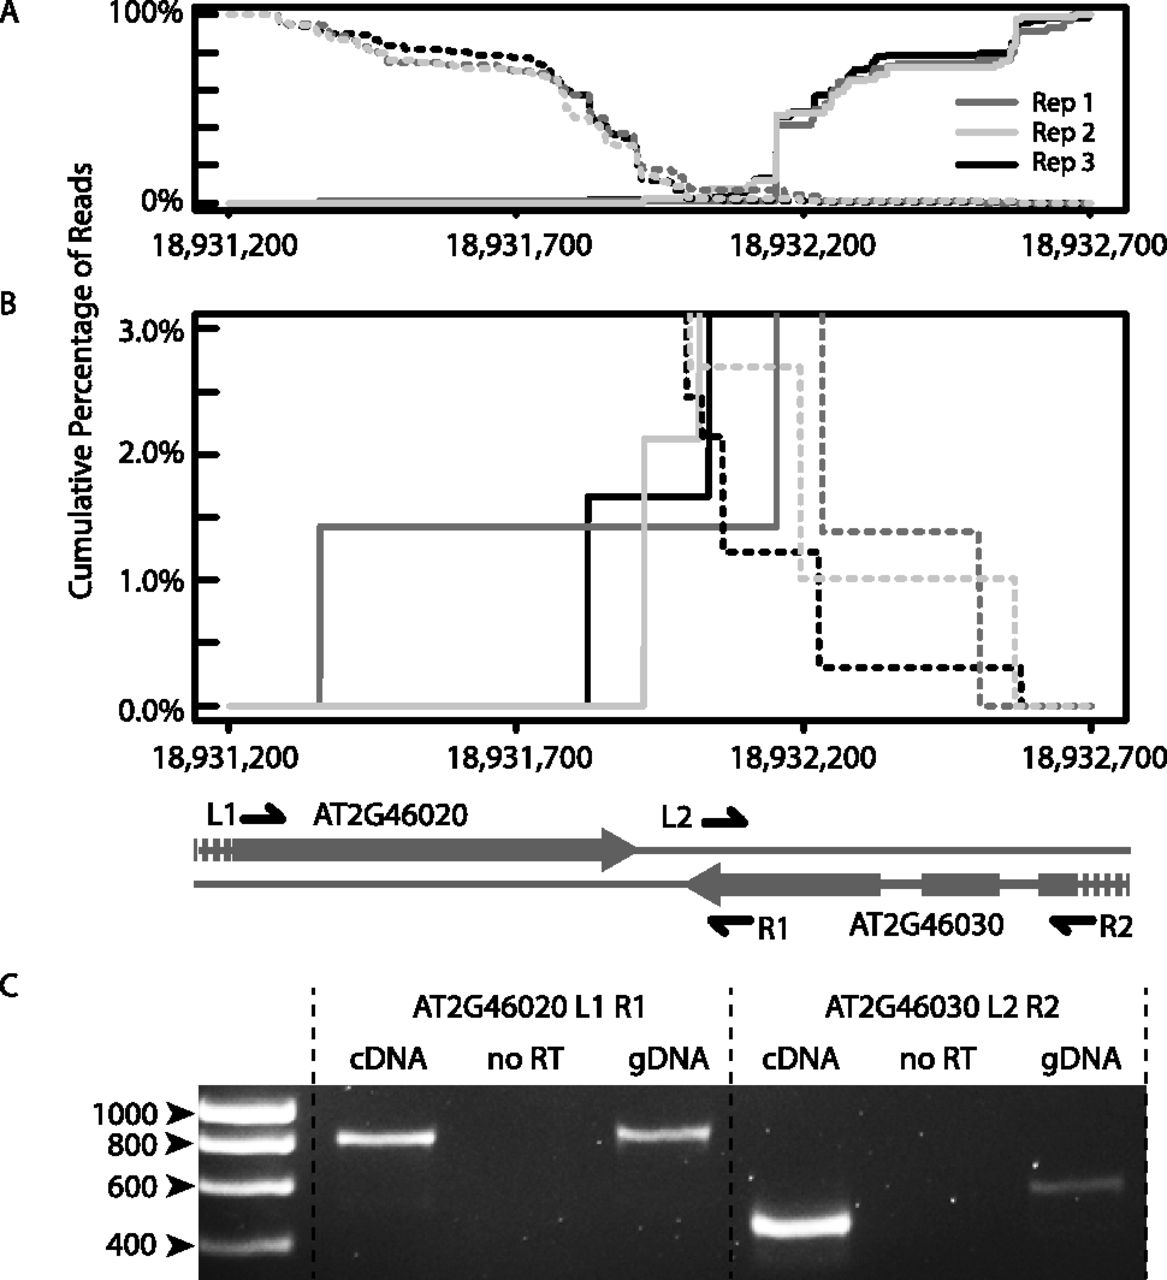
Experimental validation of novel predicted cis-NAT pairs. (A) Cumulative distribution of reads adjacent to the overlapping region of AT2G46020 and AT2G46030. (x-axis) Genomic location of chromosome 2 of Arabidopsis. Reads from different biological replicates are in different colors. (Solid lines) Cumulative percentage of reads that are mapped to the reverse strand. (Dashed lines) One minus cumulative percentage of reads that are mapped to forward strand. (B) Same as A, except that the cumulative distribution curves <3% are shown. Gene models are shown below the distribution curves. Arrow heads indicate the direction of the genes. Thick lines represent the exons; thin lines between thicker lines are introns. The locations of primer pairs (L1/R1 and L2/R2) are shown as black arrows. (C) Reverse transcription (RT)-PCR validation of the predicted overlapping genes. No RT reaction was used as negative control. Genomic DNA (gDNA) was used as positive control.


