
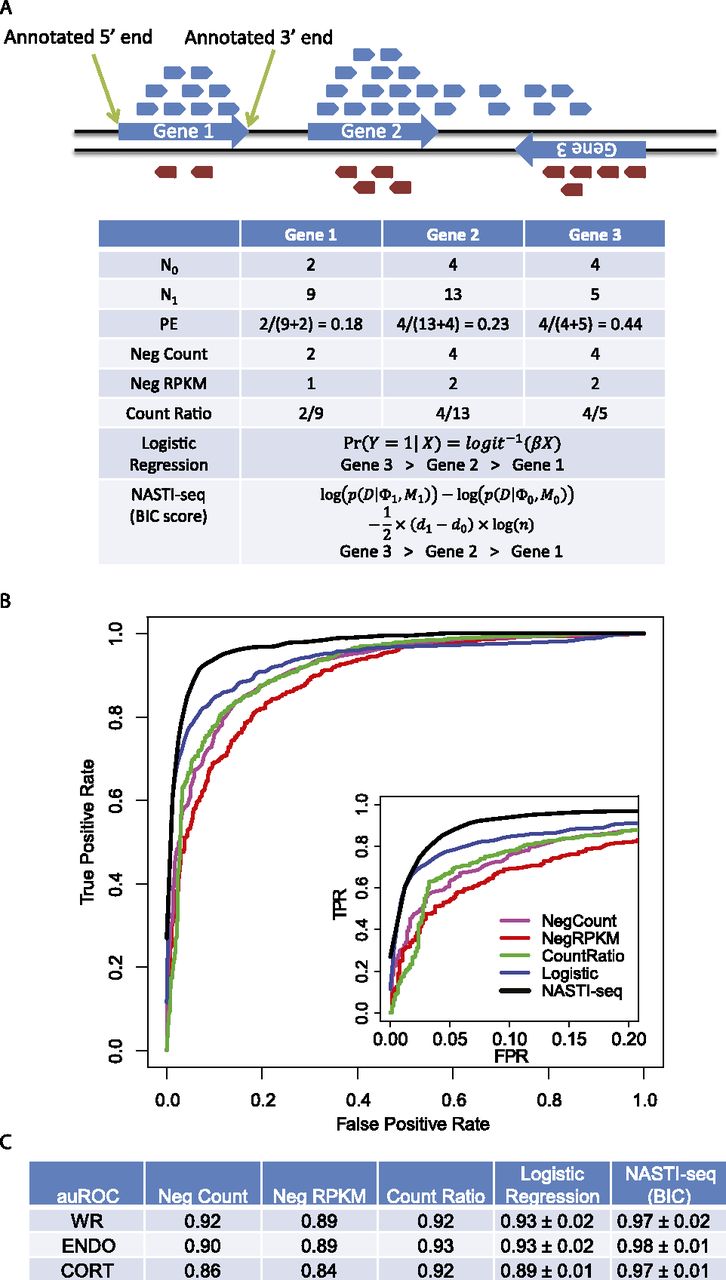
Statistical framework for the identification of cis-NAT gene pairs. (A) Illustration showing read distribution for a strand-specific protocol. Reads that are mapped to the forward and reverse strands of the genome are colored in blue and red, respectively. (Blue arrows) Gene models (including UTRs). Summary statistics used in the comparisons are shown in the table. (N0) Number of reads from the unexpected strand. For gene 1 and gene 2, N0 equals the number of red reads that mapped within the annotated gene boundaries. For gene 3, N0 equals the number of blue reads that mapped within the annotated gene boundaries. (N1) Number of reads from the expected strand. (PE) Strand-specific protocol error rate. (Neg Count) Number of reads from the unexpected strand. (Neg RPKM) Read per kilobase per million reads (RPKM) for the reads from the unexpected strand. To calculate RPKM, all genes are assumed to be 2000 base pairs in length, and the library size is assumed to be one million reads. (Count Ratio) The ratio of N0 and N1. (Logistic Regression) Log probability was used to rank genes. (NASTI [BIC score]) The BIC score was used to rank genes. (B) Receiver operating characteristic (ROC) curves for the comparison of different classification methods. (FPR) False positive rate. (TRP) True positive rate. (Inset) The same curves with FPR between 0 and 0.2. (C) Area under the ROC curve (auROC) comparison of different methods. For both logistic regression and NASTI-seq, standard deviations of the auROC from 10-fold cross-validation are shown. (WR) Whole-root sample. (ENDO) Endodermis sample. (CORT) Cortex sample. Cross-validation is not available for simple methods (Neg Count, Neg RPKM, Count Ratio).


