
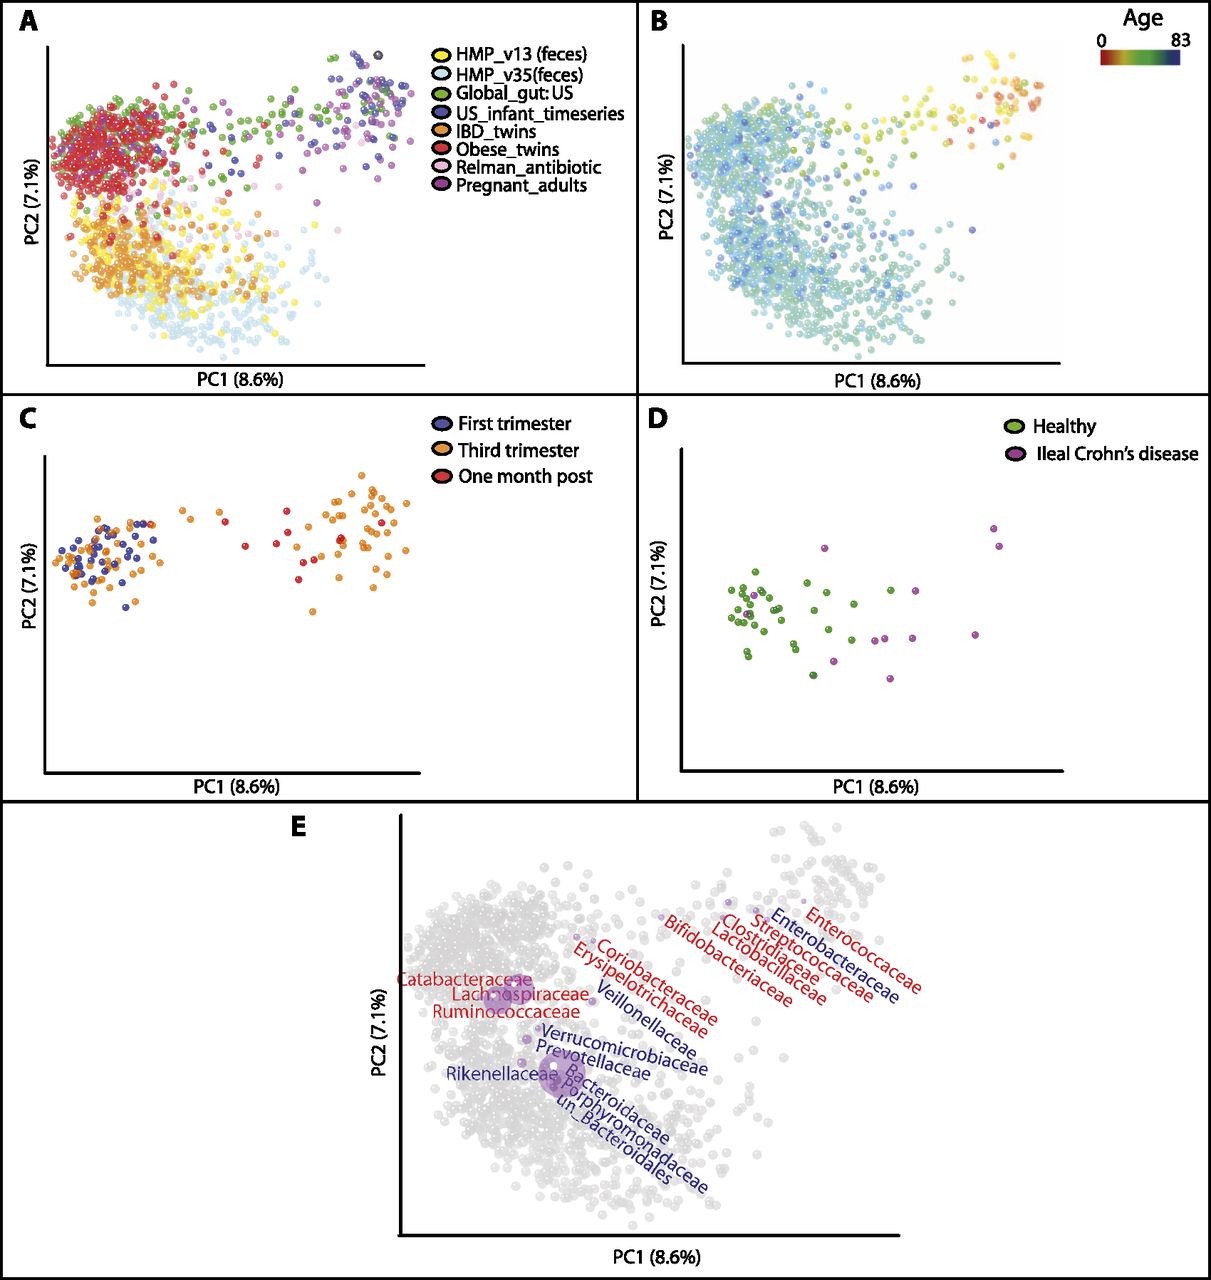
Unweighted UniFrac PCoA plots illustrating the relationship between the bacterial diversity in fecal samples from different disease/physiologic states in adults and the infant microbiome. (A) Compares samples from same studies as in Figure 3A, but with the US_infant_timeseries, the US infants and children from Global_gut, and adults from a study of pregnancy (Pregnant_adults) (Table 1) added in addition. (A–D) The same plot, except that different subsets of the samples are shown or are colored differently. (A) Points colored by study. (B) Points colored by an age gradient. The samples from Pregnant_adults are not shown because the age of study participants was not available. (C) Samples from pregnant women in their first and third trimesters and 1 mo post-delivery (from Pregnant_adults) (Table 1) (D) Healthy individuals and individuals with ileal Crohn's disease from IBD_twins. (E) Bacterial families are plotted as a weighted average of the coordinates of all samples where the weights are the relative abundances of the taxon in the samples (purple circles). Gram-negative bacterial orders are in blue text, Gram-positive in red.


