
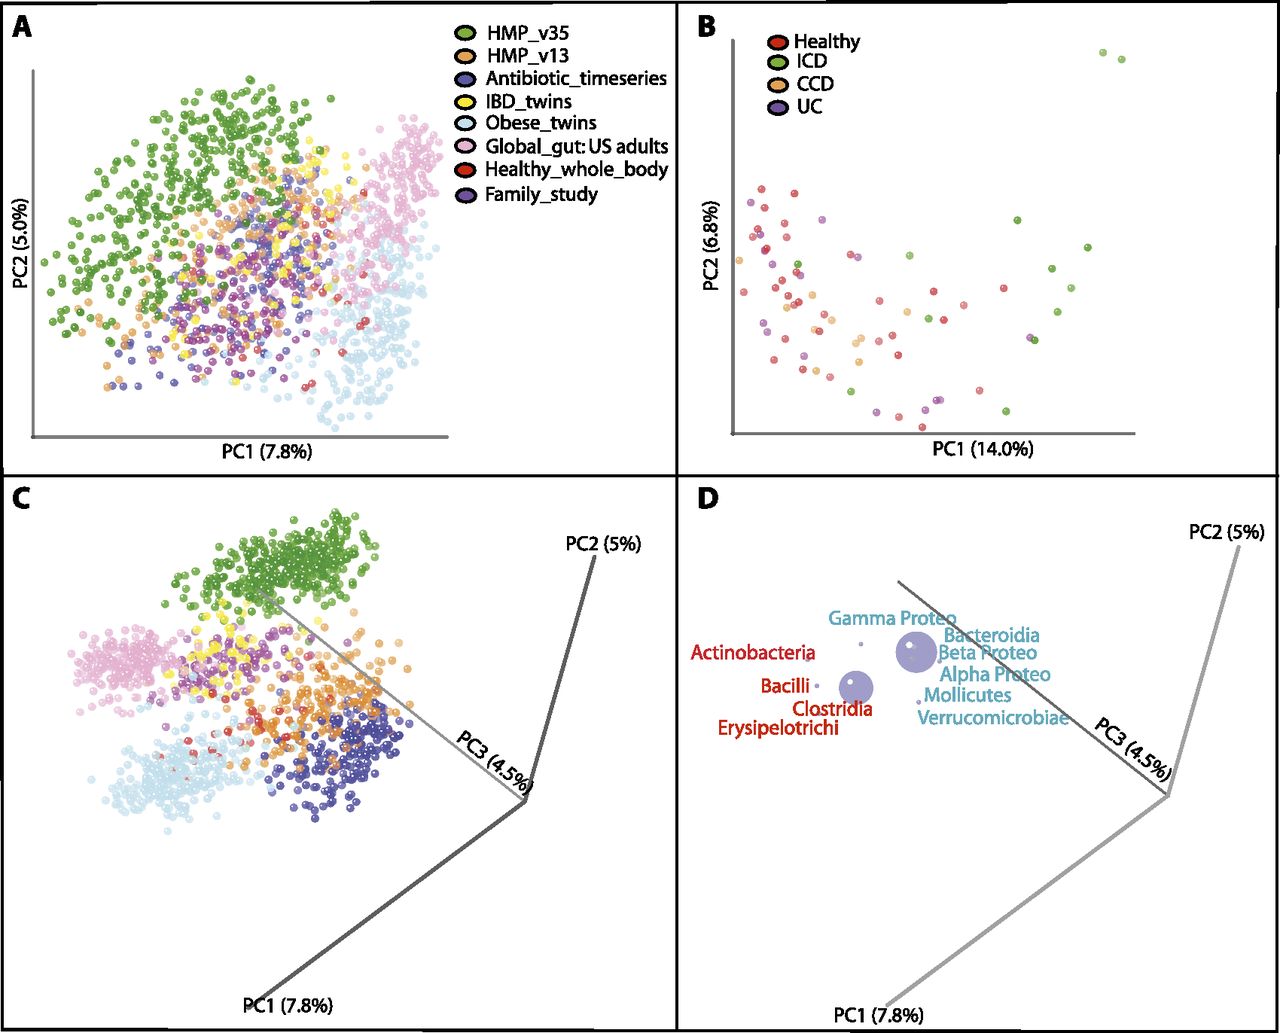
Unweighted UniFrac PCoA plots illustrating a strong study effect when comparing fecal samples of Western adults. (A) Studies conducted with Western adult populations. (B) Clustering of the fecal samples from IBD_twins (Table 1) colored by disease state. (ICD) Ileal Crohn's disease, (CCD) Colonic Crohn's Disease, (UC) Ulcerative Colitis. (C,D) Same as in A but with the axes rotated to maximize clustering by study. D shows just the bacterial orders as a weighted average of the coordinates of all samples, where the weights are the relative abundances of the taxon in the samples. The size of the sphere representing a taxon is proportional to the mean relative abundance of the taxon across all samples. Gram-positive bacterial orders are labeled in red text and Gram-negative in blue.


