
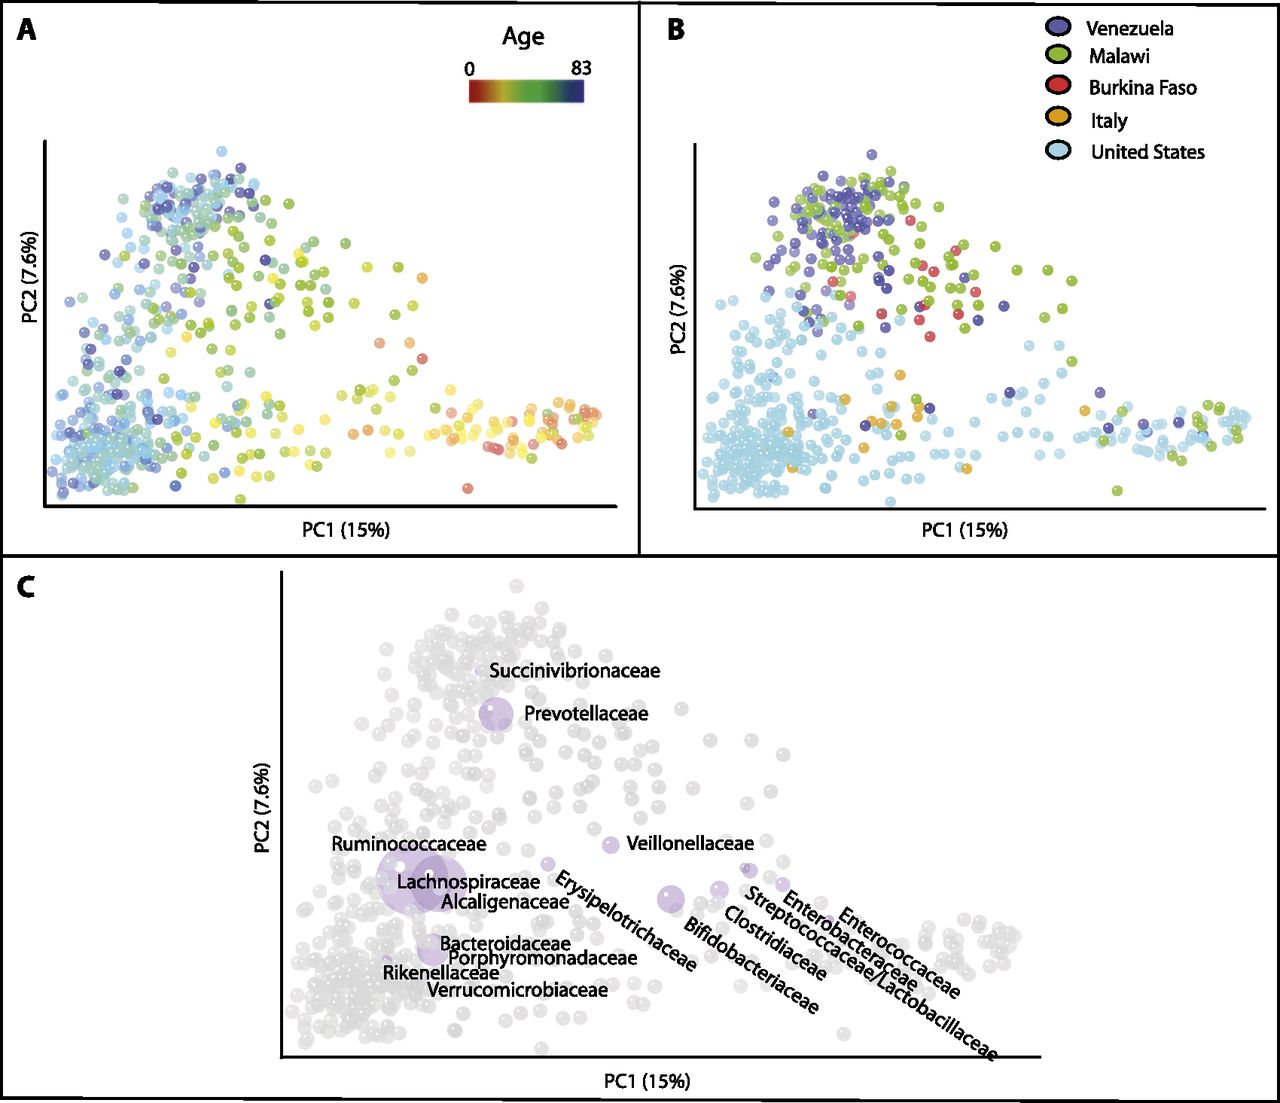
Unweighted UniFrac PCoA plots illustrating the relative degree to which age, cultural/geographic stratification, systematic differences in the collection of samples, and sequencing method affect the observed diversity of the gut microbiota. (A–C) Data from three different studies with age gradients from culturally diverse populations (Global_gut, US_infant_timeseries, and Italy/Burkina Faso) (Table 1). Points are colored by age gradient in A or by county in B. C plots the most abundant bacterial families as a weighted average of the coordinates of all samples in purple, where the weights are the relative abundances of the taxon in the samples. The size of the sphere representing a taxon is proportional to the mean relative abundance of the taxon across all samples.


