
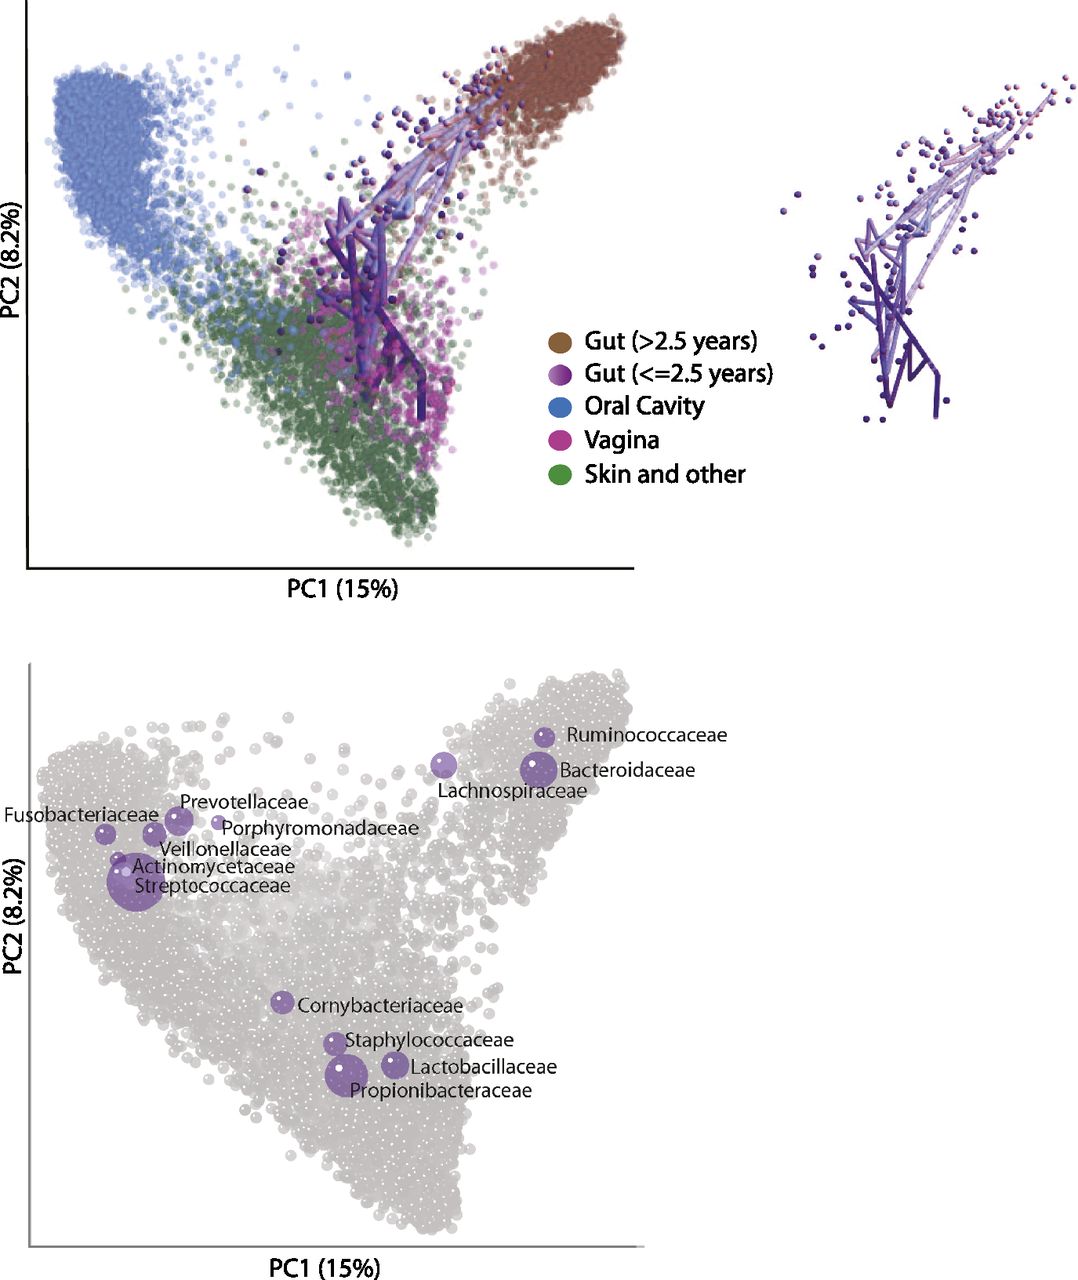
Unweighted UniFrac PCoA plot illustrating that samples from the human microbiome cluster primarily by body site. Each point represents a sample from one of the studies detailed in Table 1. Samples were classified broadly as from the Gut (mostly feces but also colon, ileum, and rectum), vagina, oral cavity (e.g., saliva, tongue, cheek), and skin and other (diverse skin sites, hair, nostril, and urine). Gut samples from individuals older than 2½ yr are colored brown and from individuals ages 0 to 2½ yr are colored across a dark purple (0 yr) to light purple (2½ yr) spectrum. Samples from one infant sampled repeatedly over the first 2½ yr of life are joined together with a purple line with a decreasingly dark hue with age. The infant samples are also shown in the inset. The most abundant bacterial families are superimposed on the same PCoA plot in the lower panel in purple. The size of the sphere representing a taxon is proportional to the mean relative abundance of the taxon across all samples.


