
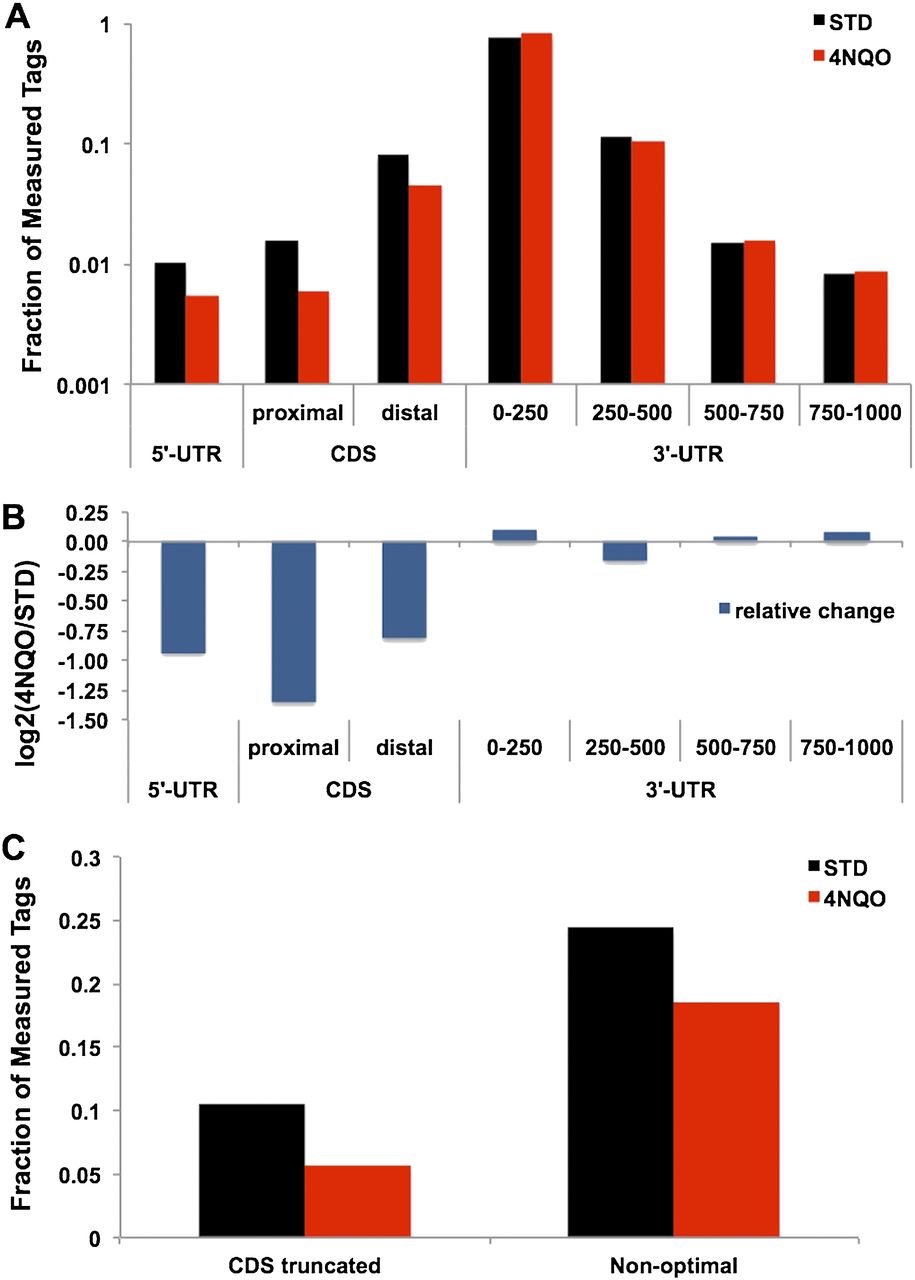
The distribution of DRS tags, indicating putative poly(A) sites, within annotated gene structures. (A) The fraction of the DRS sites identified within each gene region shows a downstream shift following exposure to 4NQO. The CDS is separated into proximal (<100 nt from the AUG start codon) and distal (>100 nt). (B) A logarithmic plot of the ratio of 4NQO to STD (untreated) counts from A. (C) The fraction of the tags in each sample assigned to distinct parts of gene structures. On the left (labeled CDS-truncated) is the fraction upstream of the stop codon, indicating a putatively truncated protein coding sequence. On the right (labeled Non-optimal) is the fraction that lies outside of the first 250 nt of the 3′ UTR.


