
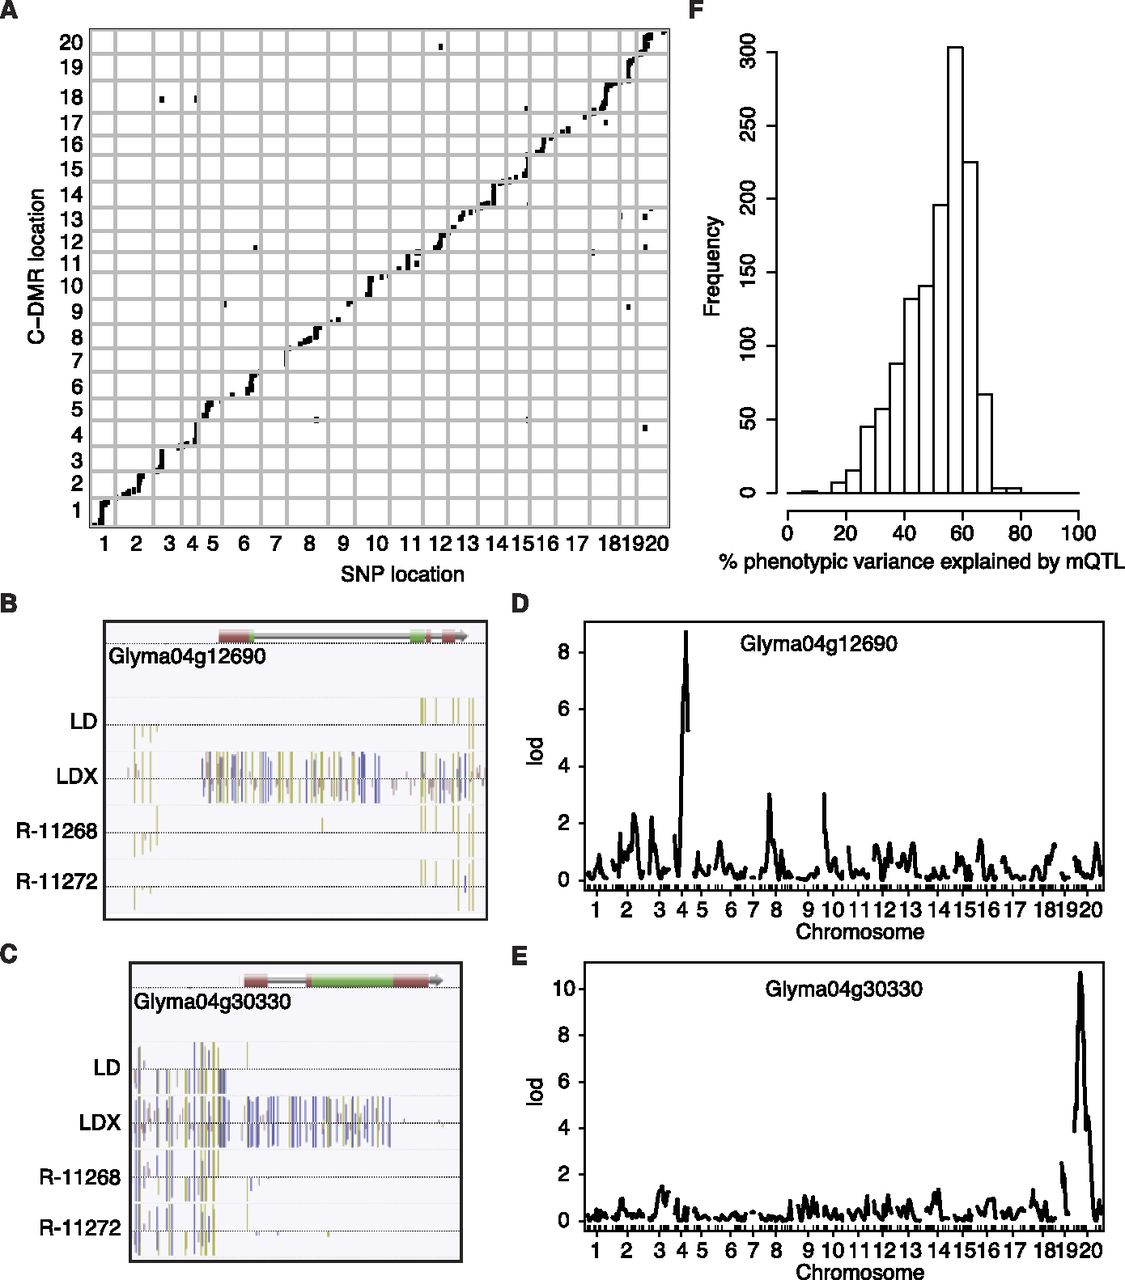
Figure 6.
Population-level analysis of methylation variants and identification of methylQTL. (A) Scatter plot of the location (x-axis) of all single methylQTL identified for C-DMRs (y-axis). (B,C) DNA methylation profiles for LD, LDX, R-11268 and R-11272 of two different C-DMRs. (Gold lines) mCG; (purple lines) mCHG; (pink lines) mCHH. (D) An example QTL map of a local methylQTL and (E) a distant methylQTL. (F) Broad-sense heritability estimates for all single methylQTL/C-DMR pairs.


