
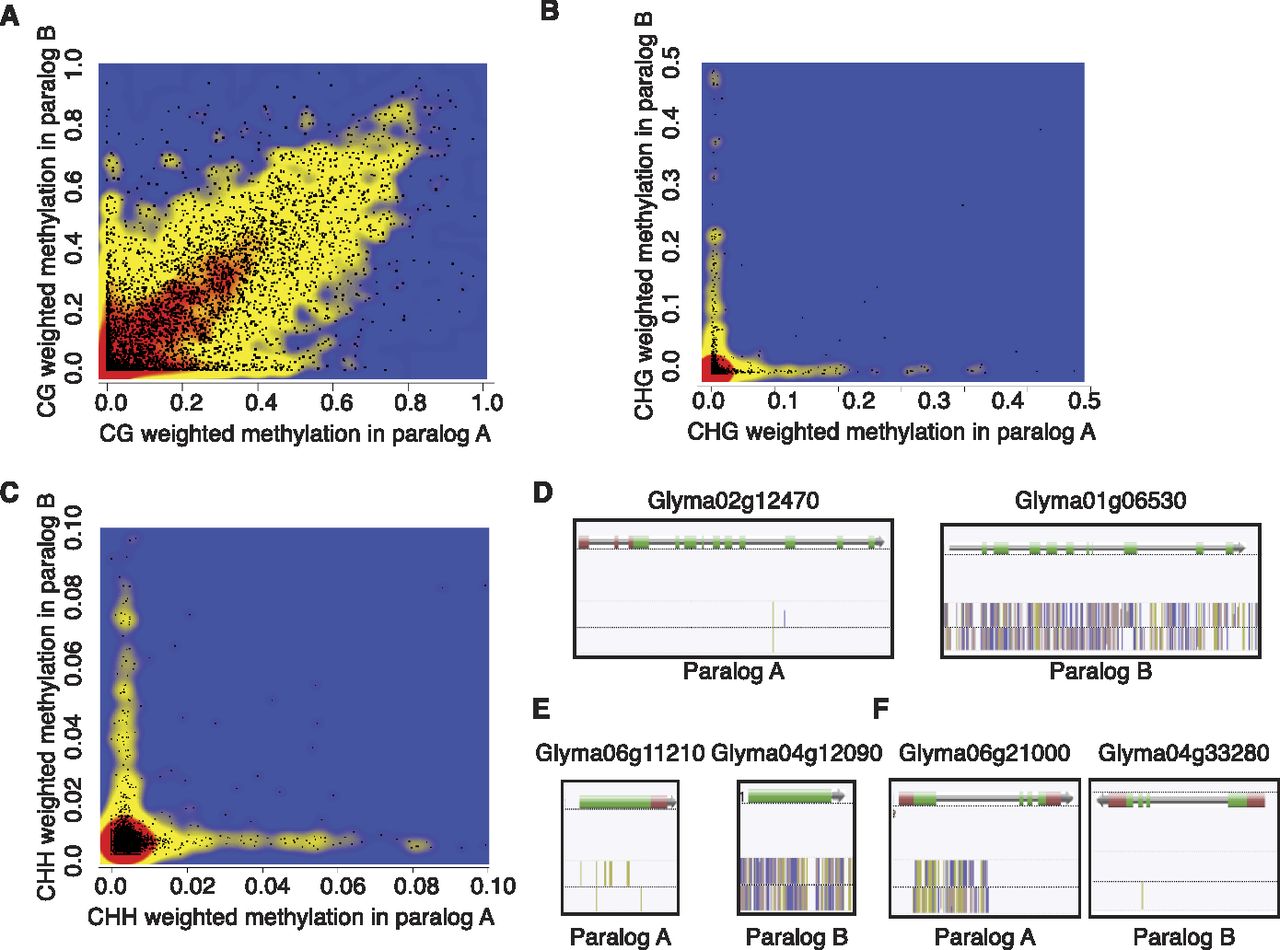
Figure 4.
Pairwise methylation levels for paralog gene pairs. (A–C) Pairwise plots of CG (A), CHG (B), and CHH (C) methylation levels for all paralog pairs of genes. The A form of the paralog is plotted along the x-axis and the B form is plotted along the y-axis. (D–F) Examples of variation in RdDM-like methylation between paralog pairs in the LD methylome. (Gold lines) mCG; (purple lines) mCHG; (pink lines) mCHH. Loci containing >0.5% non-GC methylation levels were excluded from the plot in A, and genes containing >2.5% mCHG in B and C were considered targets of RdDM.


