
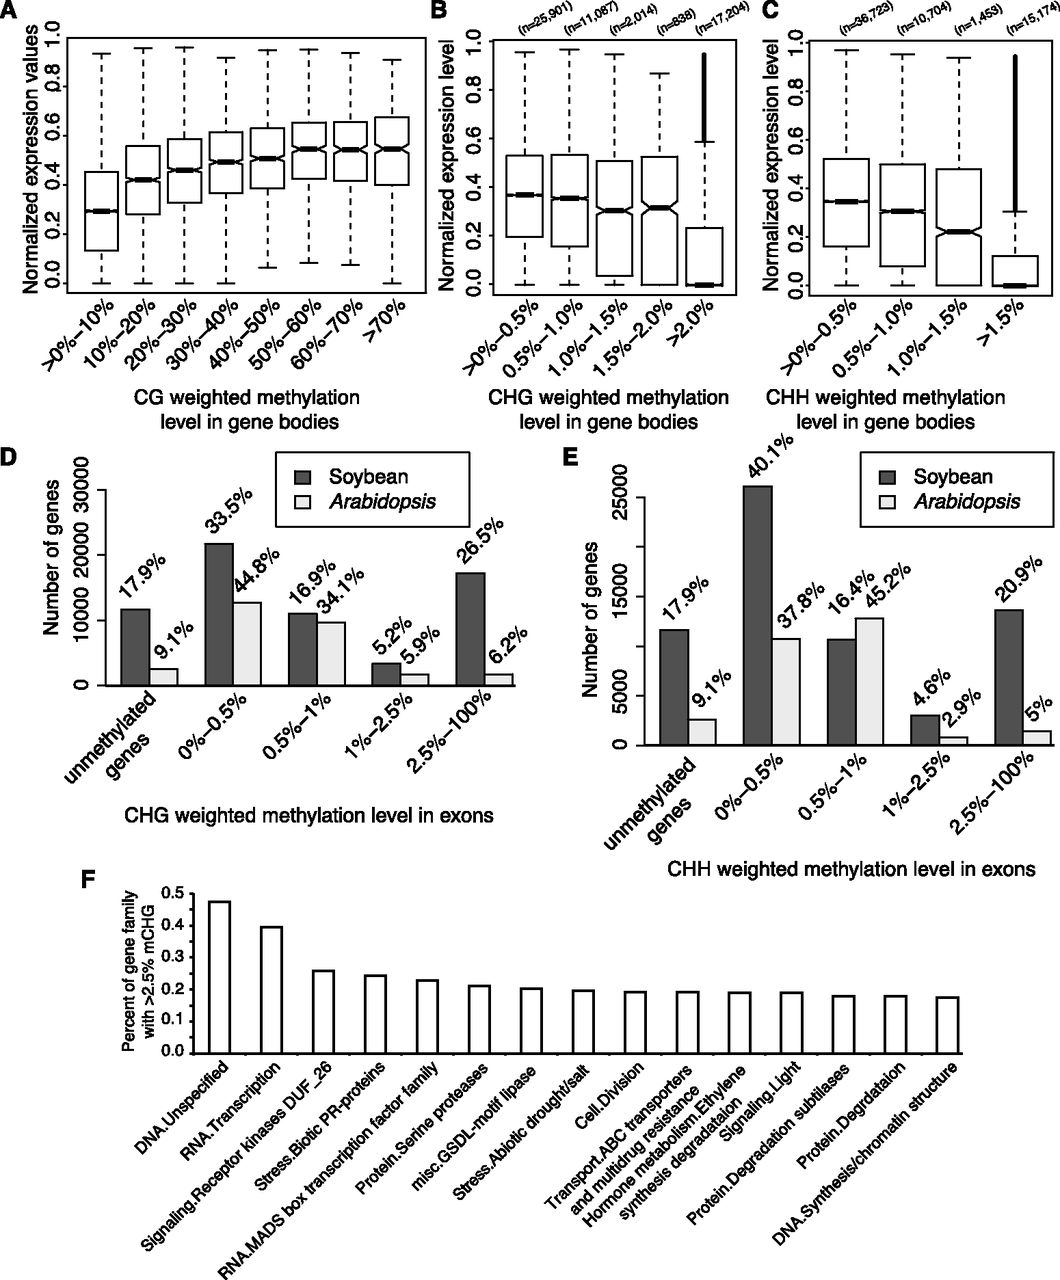
The association between DNA methylation and gene expression levels in soybean. (A) Increasing levels of CG gene-body methylation is correlated with increasing levels of gene expression. Box plot representation of different levels of CG gene-body methylation is displayed along the x-axis, whereas normalized gene expression levels are plotted on the y-axis. Genes containing >0.5% non-GC methylation were filtered from this analysis. Increasing methylation levels of both CHG (B) and CHH (C) sites are associated with decreasing levels of gene expression levels. (D,E) The soybean genome contains a higher proportion of RdDM-targeted loci compared to the Arabidopsis thaliana genome. Fraction of genes (y-axis) targeted by varying levels of CHG (D) and CHH (E) DNA methylation (x-axis). Unmethylated genes were defined as loci containing <0.5% CG, CHG, and CHH methylation. (F) Gene families containing the highest fraction of members containing >2.5% weighted CHG methylation. Only gene families with more than 100 members were considered in this analysis and only the top fifteen classes are displayed.


