
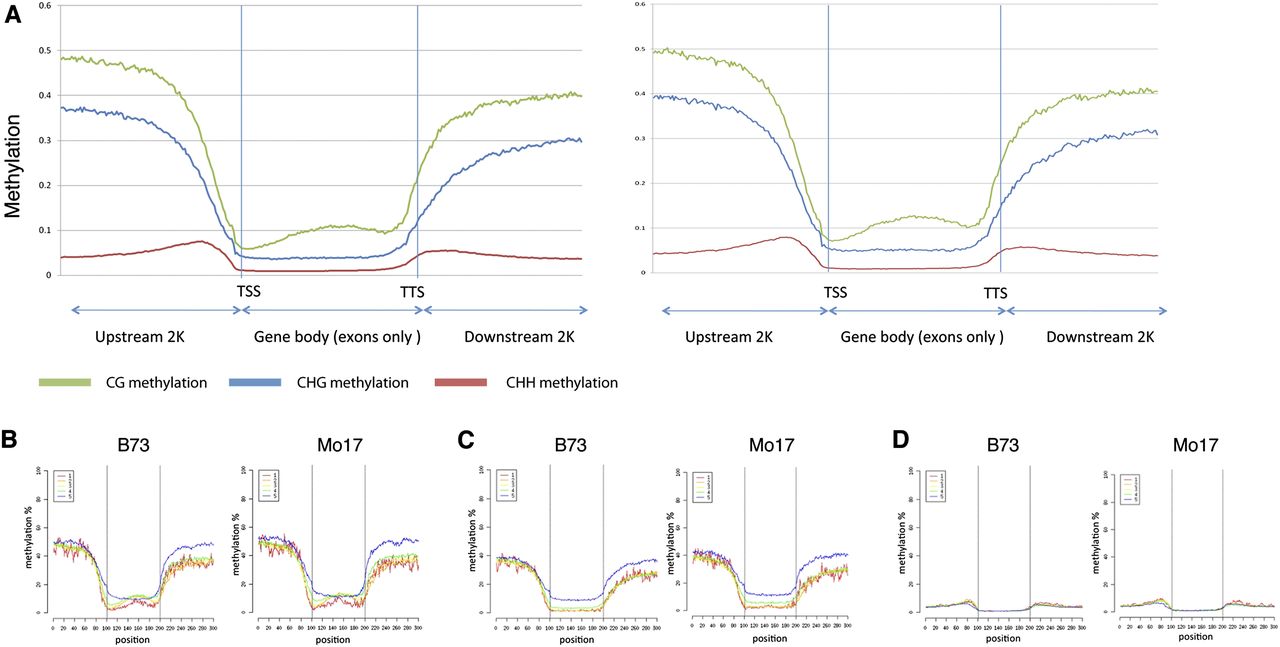
Figure 3.
Exon methylation. (A) Methylation levels in each context, CG (green), CHG (blue), and CHH (red), are summed across all exons via the “metagene” analysis (see Methods) for each inbred. Genes were divided according to expression levels ([1] high; [5] low), and CG methylation (B), CHG methylation (C), and CHH methylation (D) was plotted for each inbred.


