
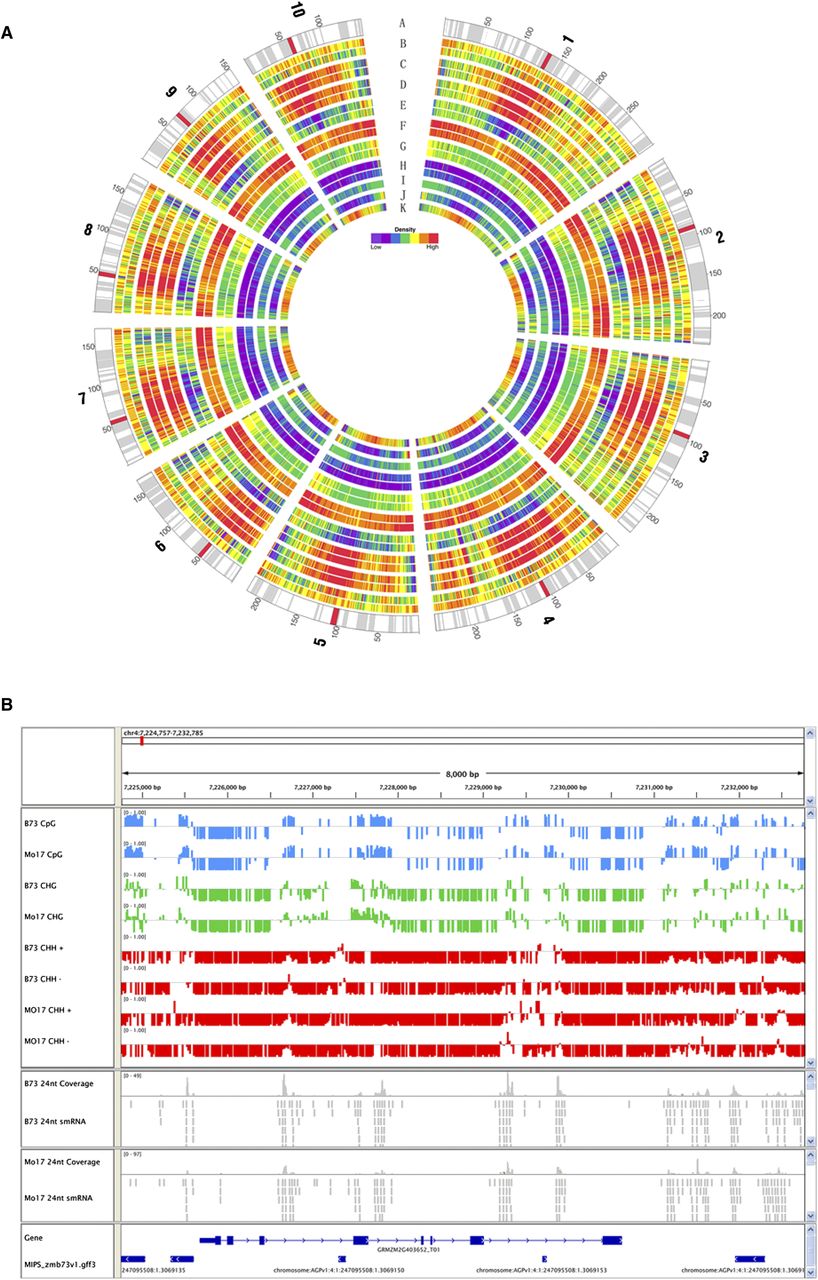
Genome-wide patterns of DNA methylation. (A) Circle diagram of all 10 maize chromosomes. The tracks represent sequence scaffolds with centromeric regions labeled in red (A), read coverage (B), methylation at CG (C), CHG (D), and CHH (E), 24-nt (F), 22-nt (G), and 21-nt (H) small RNAs. Within each pair, the outer track is B73, the inner track is Mo17. Track I represents methyl filtration reads, J genes, and K repeats from the B73 genome. “High” on the Density scale means a high density of features presented in a given track. (B). An image from the Integrative Genomics Viewer software (Robinson et al. 2011) showing information from an 8-kb region on chromosome 4 (7,224757–7,232785 bp). The first eight data tracks show methylation levels for B73 and Mo17 in different sequence contexts. Methylation levels are displayed on a scale from 0 to 1. The 24-nt small RNA coverage graphs indicate coverage depths for positions with 24-nt small RNA sequencing data for B73 and Mo17, respectively.


