
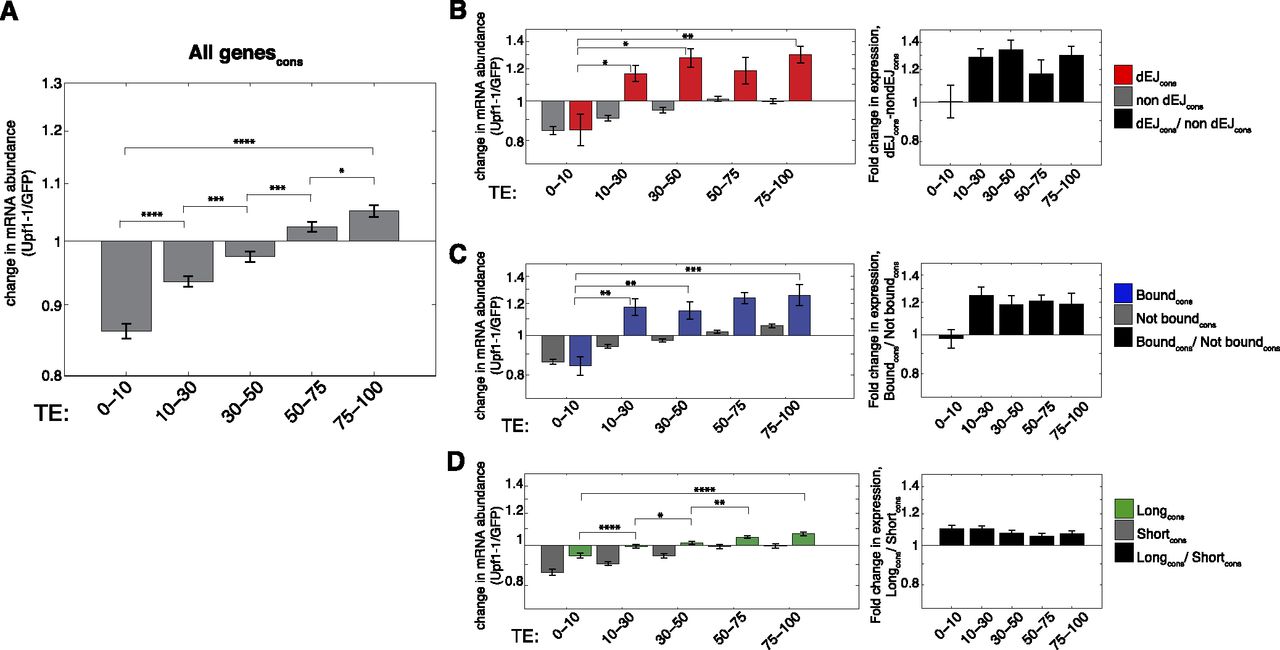
Relationship between TE and NMD-triggering gene features. (A) Median fold change of mRNA abundance following UPF1 depletion (shRNA Upf1-1) for consistently behaving genes grouped by percentile rank of translational efficiency (TE). Results were similar using shRNA Upf1-2 and CHX treatment (not shown). (B) As in A, except for non-dEJ (gray) and dEJ (red) mRNAs. Ratios of median fold change in expression following UPF1 depletion between dEJ and non-dEJ mRNAs with given TE is shown at right (black). For dEJ calculation, expression changes were calculated on an isoform level and TE was assigned based on the TE of the full ORF. (C,D) As in B, except for UPF1 binding in 3′ UTRs (C, blue) and 3′ UTR length (D, green). Long and short 3′ UTRs were defined as 1500–10,000 nt and 50–350 nt, respectively. Significance of differences in expression changes between TE bins of non-feature-containing genes (non-dEJ, not bound, and short 3′ UTR) were similar to those of all genes in A. All expression fold changes and ratios are plotted on a log2 scale. P-values calculated using Wilcoxon rank sum test. Asterisks as in Figure 1.


