
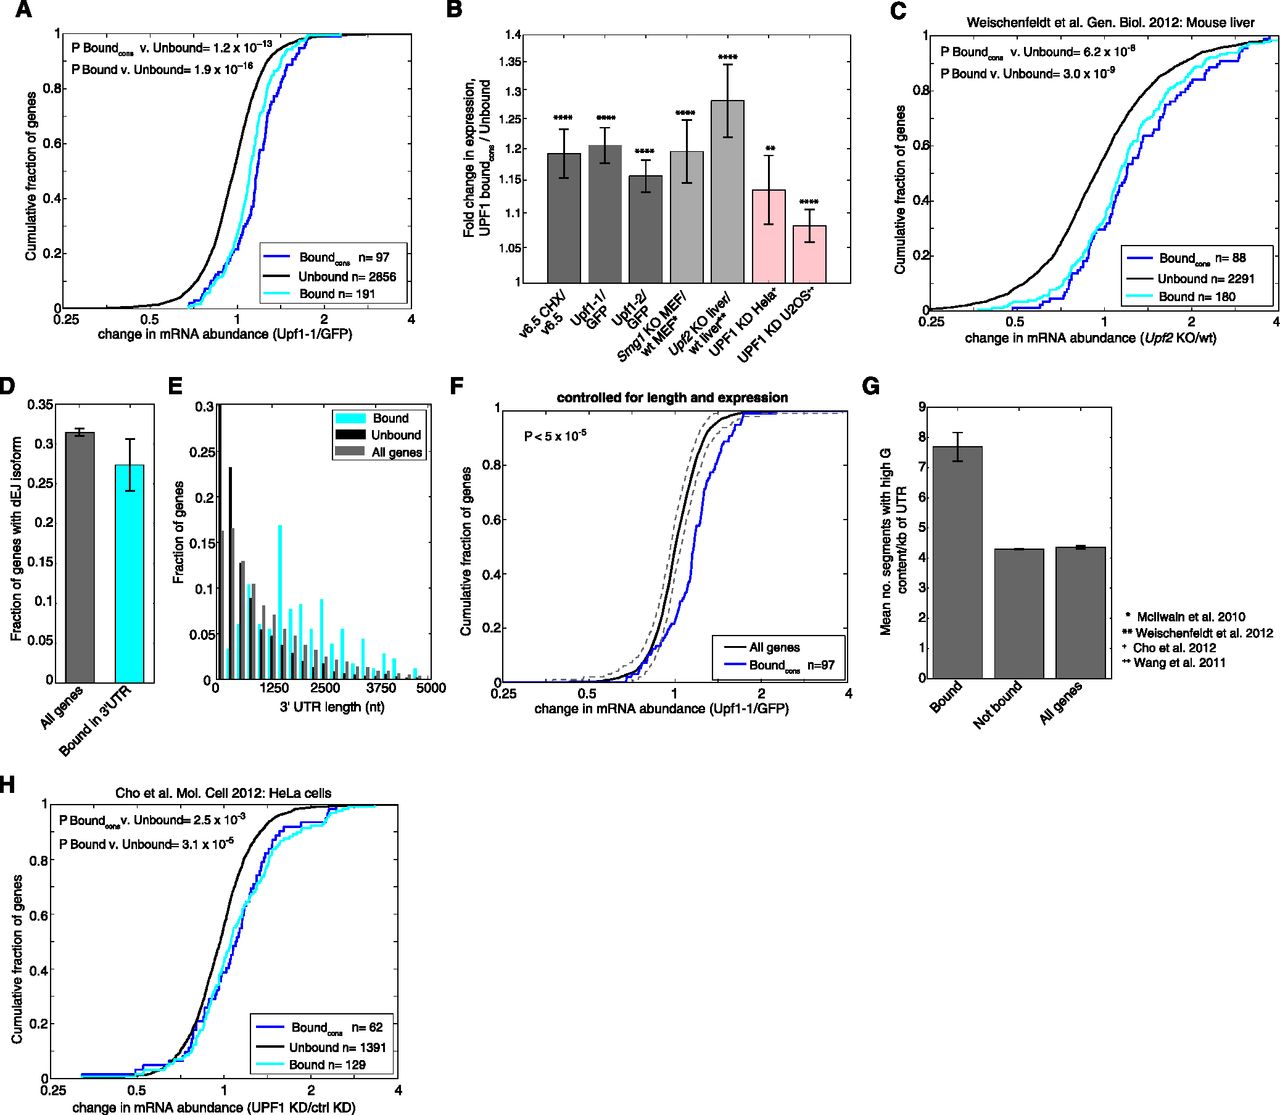
3′ UTR binding by UPF1 is associated with mRNA repression. (A) CDFs of gene expression changes following UPF1 depletion (shRNA Upf1-1) for consistently behaving genes bound by UPF1 in the 3′ UTR (blue line), all genes bound by UPF1 in the 3′ UTR (cyan line), and unbound genes (black line). (B) Ratios of median fold expression change following NMD inhibition between consistently behaving genes bound by UPF1 in the 3′ UTR and unbound genes in mESCs (dark gray), as well as for Smg1 KO in MEFs (McIlwain et al. 2010), and Upf2 KO in mouse liver (Weischenfeldt et al. 2012) (light gray), and for human homologs of these genes following UPF1 depletion in HeLa (Cho et al. 2012) and U2OS cells (Wang et al. 2011) (pink). Error bars represent standard error of the two populations compared. (C) As in A, except mRNA abundance measurements were made in wild-type and Upf2 KO mouse liver (Weischenfeldt et al. 2012). (D) Fraction of all genes and genes bound by UPF1 in the 3′ UTR that have an annotated isoform harboring a dEJ. Error bars indicate binomial standard deviation. (E) Distribution of 3′ UTR lengths of genes bound by UPF1 in their 3′ UTRs. Lengths were assigned based on the best-annotated isoform for each gene. (F) As in A for consistently behaving genes bound in the 3′ UTR by UPF1 and genes sampled with replacement to match the distribution of expression levels and 3′ UTR lengths. Significance was calculated by bootstrapping (n = 20,000). Mean and 95% confidence intervals of subsampled populations are shown in black and gray lines. Median fold change in expression between UTR groups shown is 1.16, and results were similar using shRNA Upf1-2 and CHX treatment (median fold changes 1.10 and 1.15, respectively) (data not shown). (G) Mean number of 50-nt regions with high G content (95th percentile) per kb of 3′ UTR for genes with UPF1-bound 3′ UTRs, all genes, and genes not bound by UPF1 (controlled for expression level and 3′ UTR length). Error bars represent standard error of the mean (Bound or All genes) or standard error of the means of sampled populations (Not bound). (H) As in A, except gene names were identified by homology with mouse genes either bound or unbound by UPF1 in their 3′ UTR, and mRNA abundance measurements were made in control- and UPF1-depleted HeLa cells (Cho et al. 2012). All expression fold change values and ratios are plotted on a log2 scale. Asterisks as in Figure 1. See also Supplemental Figure S4.


