
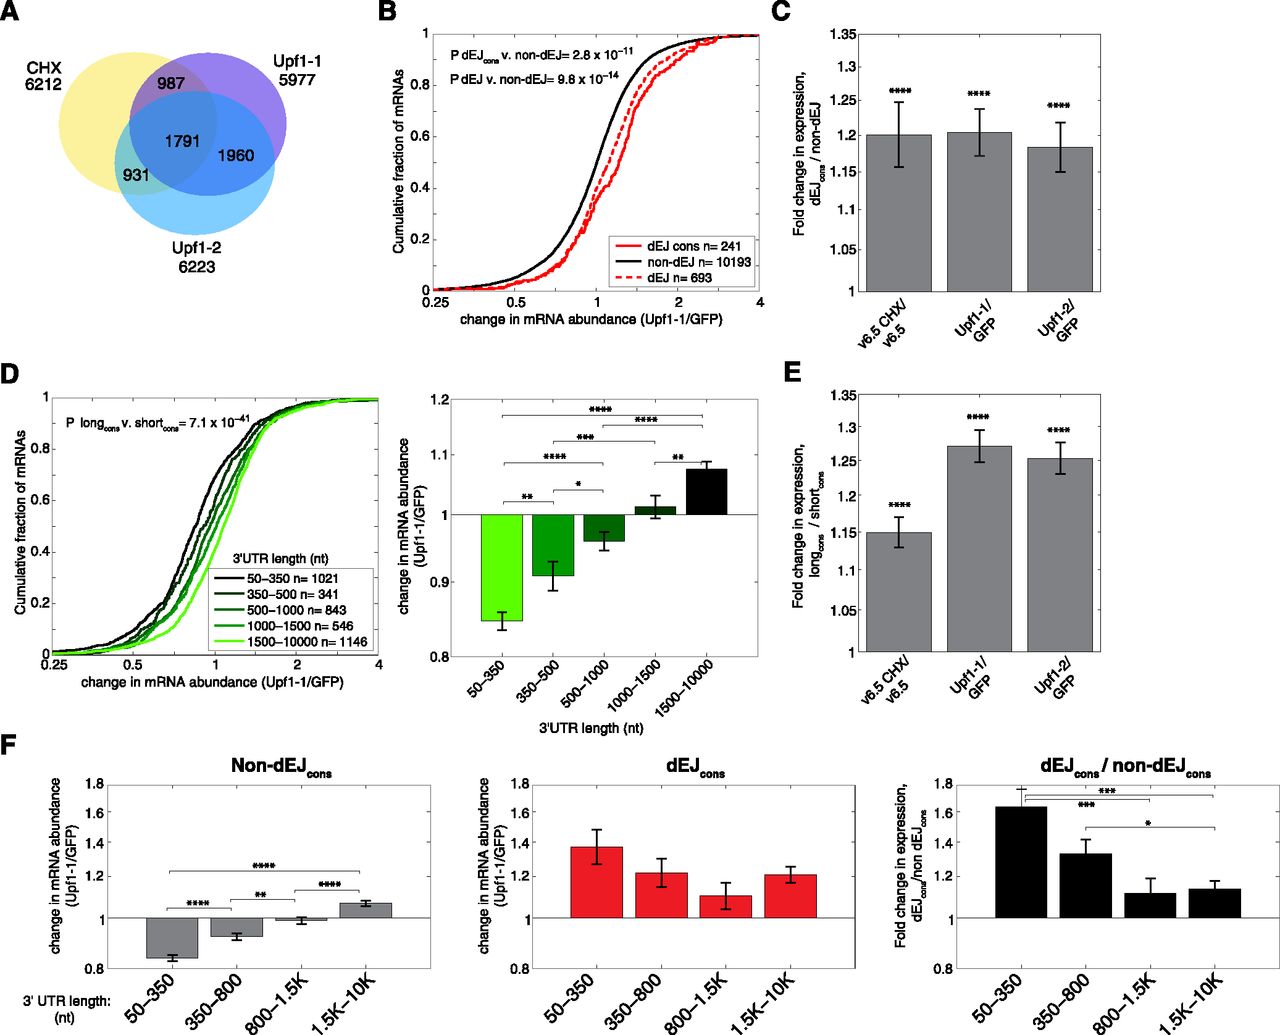
Consistent derepression of hundreds of mRNAs with and without canonical NMD features occurs following UPF1 depletion and translational inhibition. (A) Overlap of mRNAs that changed expression by more than 1.1-fold in the same direction in each of three NMD inhibition experiments (shRNA Upf1-1, shRNA Upf1-2, and CHX treatment). (B) Cumulative distribution functions (CDFs) of changes in mRNA abundance following UPF1 depletion (shRNA Upf1-1) for all dEJ mRNAs (dashed red line), consistently changing dEJ mRNAs (solid red line), or mRNAs without an annotated dEJ (black line). P-value determined by Wilcoxon rank sum test. (C) Ratios of median fold expression change following NMD inhibition of dEJcons to non-dEJ isoforms. Error bar represents standard error of the two populations compared. P-values determined as in B. (D) As in B for isoforms behaving consistently with different annotated 3′ UTR lengths (different green lines). Median expression changes and standard error are shown at right. See also Supplemental Figure S1F. (E) As in C for mRNAs with long (1500–10k nt) versus short (50–350 nt) 3′ UTRs. (F) Interaction between dEJ and 3′ UTR length. Median fold change in expression following UPF1 depletion of consistent mRNAs with different 3′ UTR lengths without (left) and with (middle) an annotated dEJ. Ratios of median expression change following UPF1 depletion between mRNAs with and without an annotated dEJ of a given 3′ UTR length (right). Significance of differences between different 3′ UTR length bins was determined by permutation test (n = 2000). This trend was also observed when comparing expression changes between each dEJ isoform and non-dEJ isoforms with equivalent 3′ UTR lengths (±10%) following NMD inhibition (Supplemental Fig. S1H). Results were similar for other NMD inhibitory treatments. All fold change values and ratios are plotted on a log2 scale. P-values: (*) P < 0.05, (**) P < 0.01, (***) P < 0.001, (****) P < 0.0001.


