
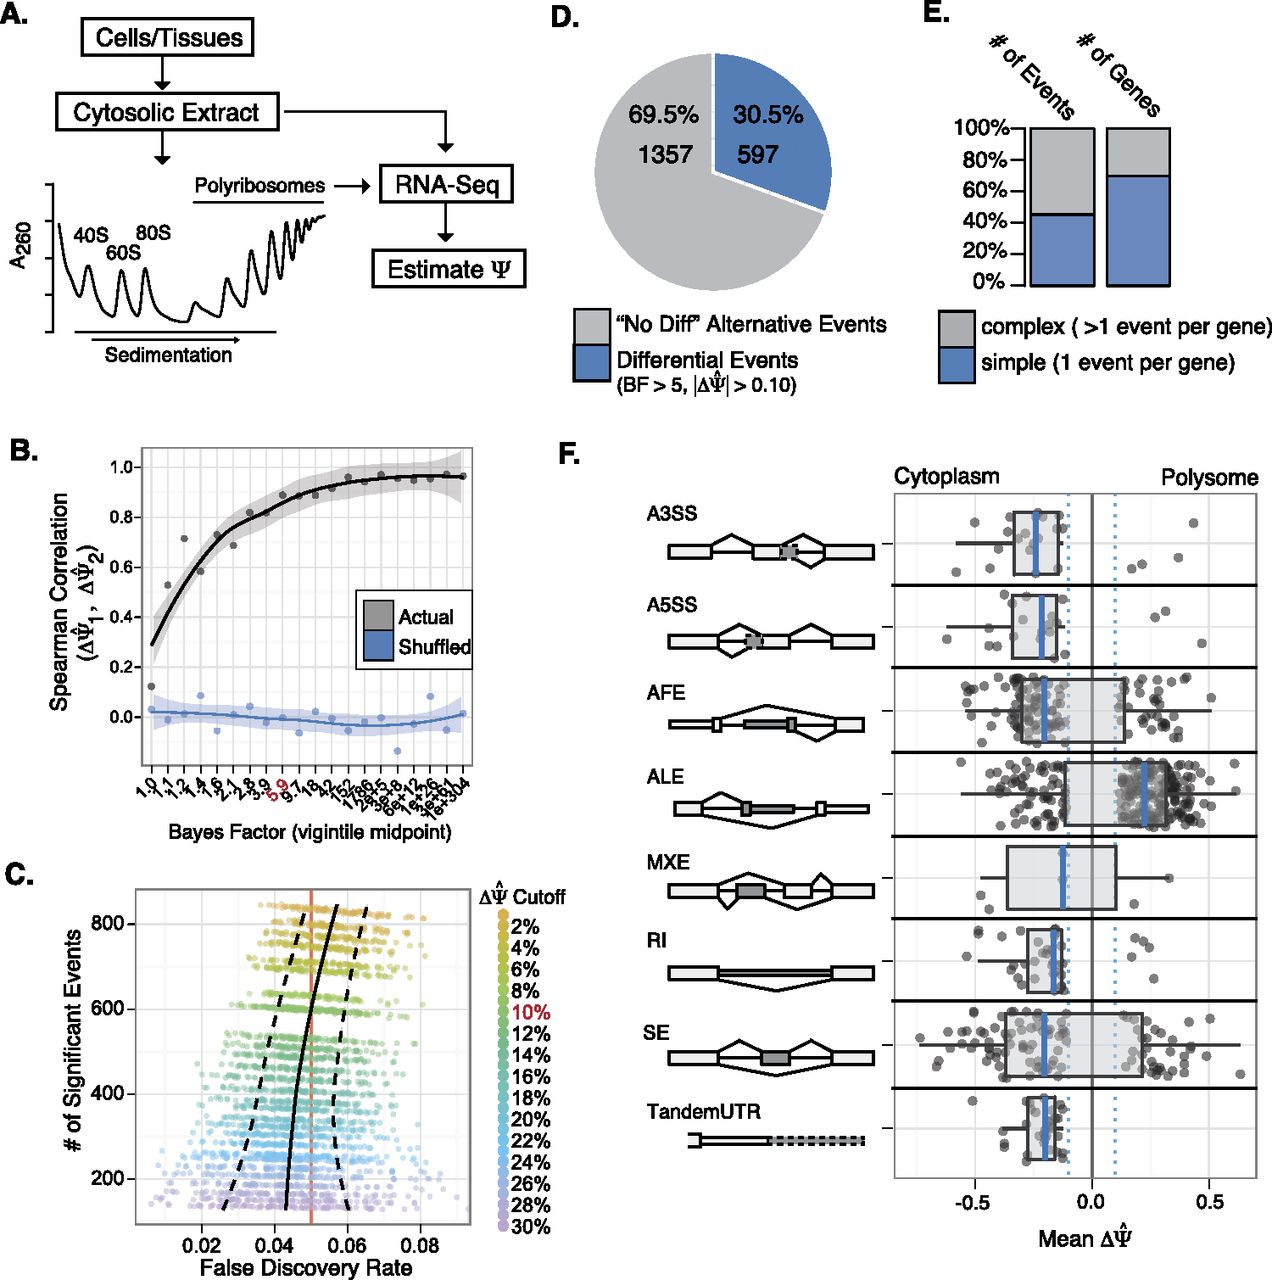
Frac-seq reveals isoform-specific differences in polyribosome association. (A) Schematic diagram of the Frac-seq protocol. (B) Bayes factor threshold estimation as a function of biological reproducibility (measured via Spearman rank correlation). Local smoothing of the mean and standard error of the mean (SEM) provided as line and shading, respectively. (C) Empirical false discovery estimation (FDR) using bootstrapped (100×) label permutation of one biological replicate for each |ΔΨ| cutoff. Mean FDR and standard error are plotted as solid and dashed lines, respectively. (D) Percentage of alternative events showing significant changes in polyribosome association (blue) compared to detectable alternatively spliced events showing no difference (gray). (E) Complexity of RNA processing events per gene (columns scaled to percentage), with complex events (more than one differential event per gene) in gray, and simple (one differential event per gene) events in blue. (F) Breakdown of significant event types and their distributions with respect to ΔΨ. Schematics on the left side present the “spliced in” region as darkly shaded. For example, the skipped exon (SE) diagram presents the shaded exon that when preferentially associated with polyribosomes would show a positive value for ΔΨ.


