
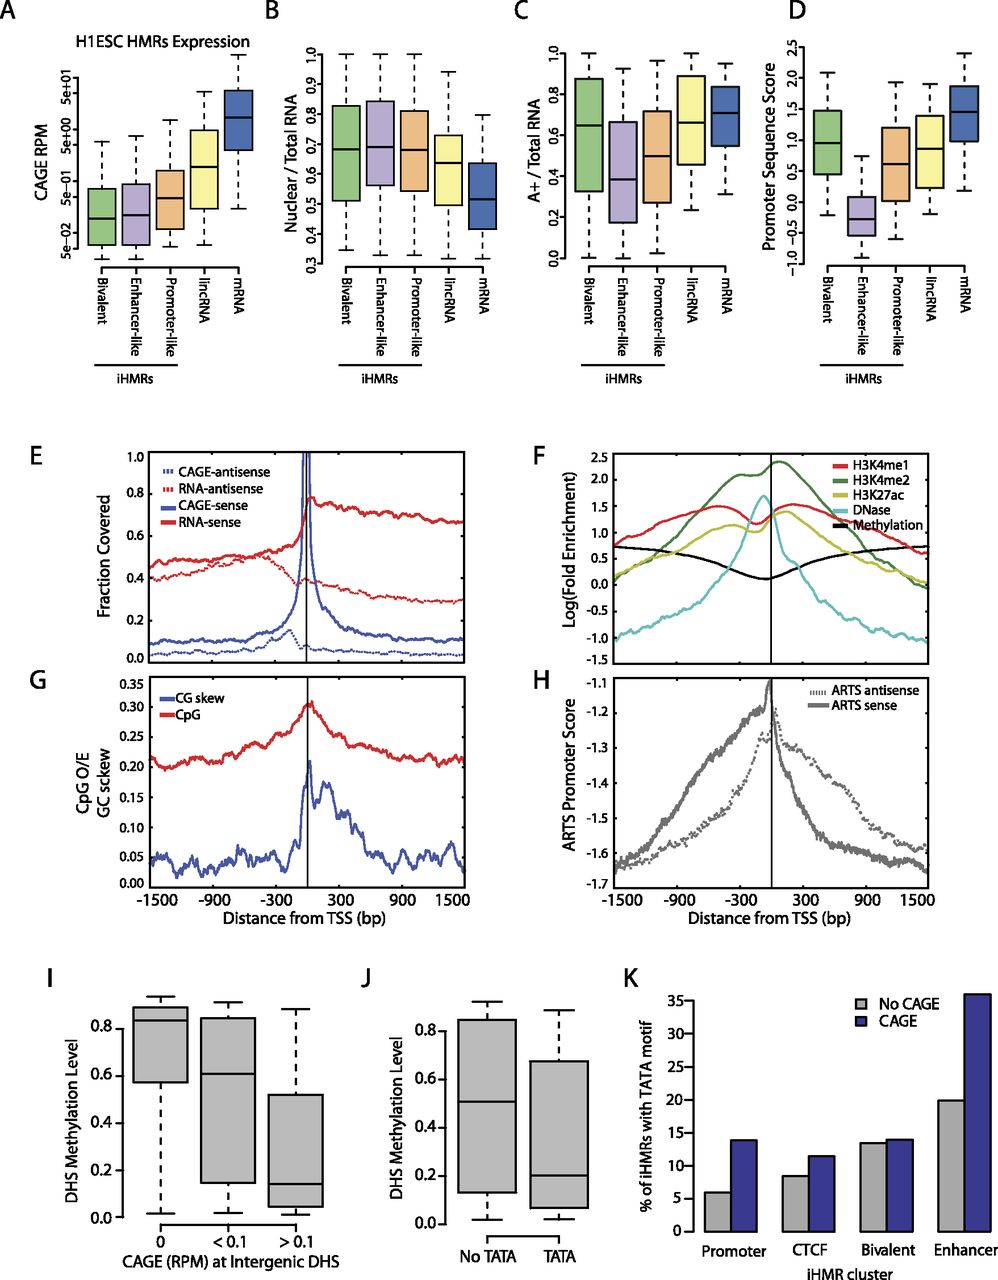
iHMRs produce different classes of transcripts from specific transcription start sites. (A–D) Different types of RNAs arise from iHMRs classes. Boxplots represent the distribution of values (fifth to 95th percentile) for each iHMR class compared with annotated lincRNAs and mRNAs. Enhancer iHMR transcripts are less expressed and less polyadenylated, while bivalent HMRs make low abundance poly(A) RNAs. Promoter-like, but not enhancer-like iHMRs contain strong promoter sequence signals. (A) Expression level, (B) nuclear localization, (C) polyadenylation levels, (D) genomic sequence-based promoter prediction scores (ARTS). (E–H) eRNA TSS positions match specific sequence and chromatin features. (E) Fraction of positions covered with RNA-seq (transcript body) and CAGE tags (TSS). (F) Specific positional arrangement of histone modifications and DNase hypersensitivity around the eRNA TSS. (G) CpG density is symmetric around the TSS, but GC-skew (strand bias of “G” vs. “C”) occurs specifically in the direction of transcription. (H) ARTS genomic sequence-based TSS prediction scores peak at the experimentally defined eRNA TSS in the sense direction. (I) Transcription is linked with hypomethylation at intergenic DHSs. Methylation levels at DHS with or without transcription are shown. (J) Presence of the TATA motif at DHS is linked with hypomethylation. Methylation levels at DHS with and without an exact TATA motif match are shown. (K) The TATA motif predicts transcription of enhancer-like iHMRs. The barplot depicts the fraction of expressed (CAGE RPM >0.1) and silent iHMRs in different clusters that contain an exact TATAAA match.


