
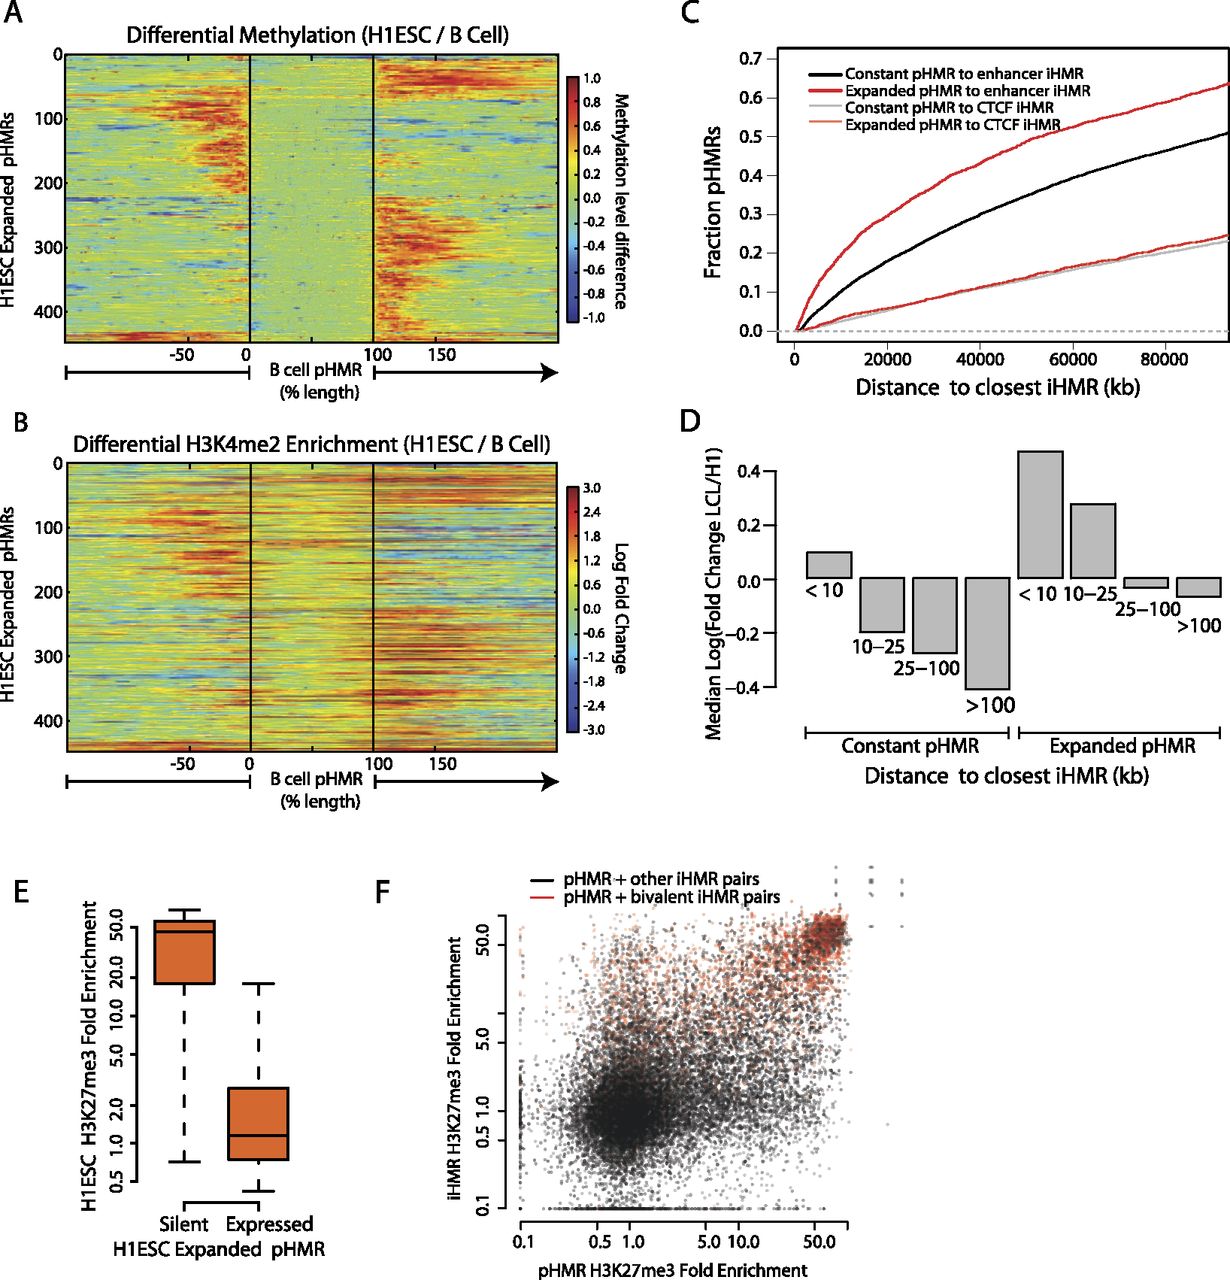
Coordinated changes in pHMRs, iHMRs, and histone marks occur at cell-type specifically regulated genes. (A) Differential hypomethylation at expanding promoter HMRs. B cell pHMRs are aligned between the black lines and color denotes the change in methylation level between H1 ESCs and B cells at each position. (B) As above, differential H3K4me2 ChIP-seq signal in H1 ESCs is displayed for the same sites. Color denotes the fold change in H3K4me2 enrichment between H1 ESCs and LCLs. (C) Enhancer HMRs are enriched near expanding promoter HMRs. Cumulative density plot showing the distances between expanded or constant pHMRs and enhancer or CTCF iHMRs. (D) Genes with both expanding pHMRs and nearby cell-type-specific iHMRs are up-regulated. Median fold expression change (CAGE signal) between LCLs and H1 ESCs for genes grouped by the distance to the closest B cell–specific iHMR and by significant expansion of their promoter HMR. (E) A subset of expanded promoter HMRs are silenced and marked with H3K27me3 in stem cells. Genes with an H1 ESC-specific expanded promoter HMR are split by their expression levels (at 1 CAGE RPM), and fold enrichment for H3K27me3 at the promoter in H1 ESCs is shown. (F) Bivalent promoters have nearby bivalently marked iHMRs. Scatterplot with H3K27me3 signal at pairs of pHMRs and nearby (<25 kb) iHMRs.


