
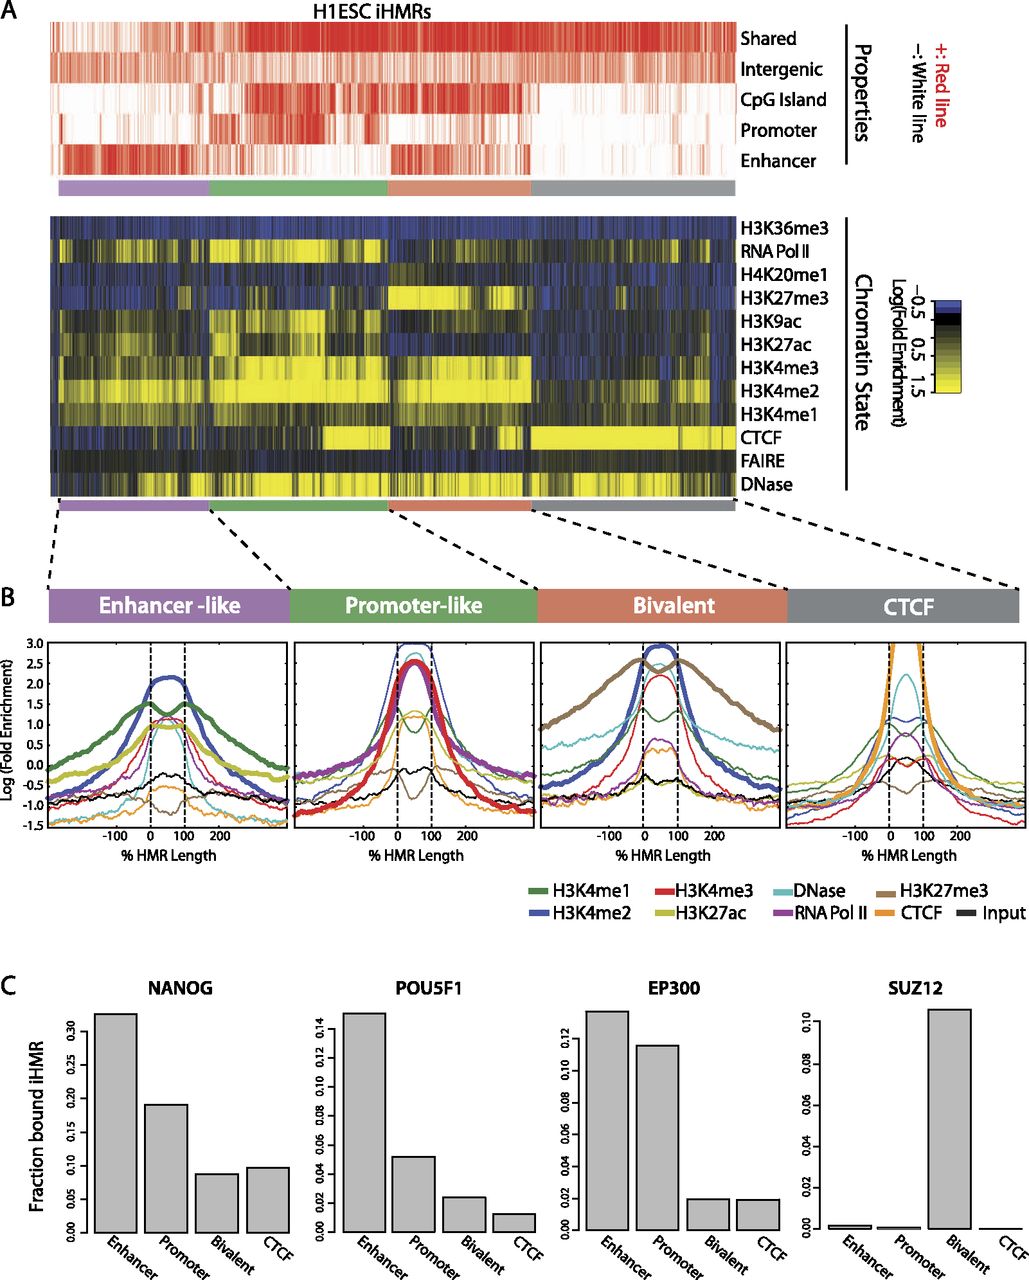
Hypomethylated regions mark different classes of active genomic regulatory elements. (A) Diverse chromatin states at H1 iHMRs. Heatmap showing the chromatin state within iHMRs. Each column represents one iHMR, sorted by hierarchical clustering, grouped into four main clusters. The top lines indicate overlap of the HMR with functional element predictions from ENCODE, CpG Islands, the iHMR location (intergenic or intronic), and whether it is shared between H1 ESCs and B cells. (B) Average chromatin mark profile in H1 ESC iHMRs of the four different clusters defined in A. HMRs are aligned between the black lines, and the fold-enrichment signals are averaged across all iHMRs at each relative position. Bold lines highlight the histone marks that distinguish each cluster. (C) Barplots show, for each of the defined classes, the fraction of iHMRs occupied by factors associated with different types of elements and chromatin states.


