
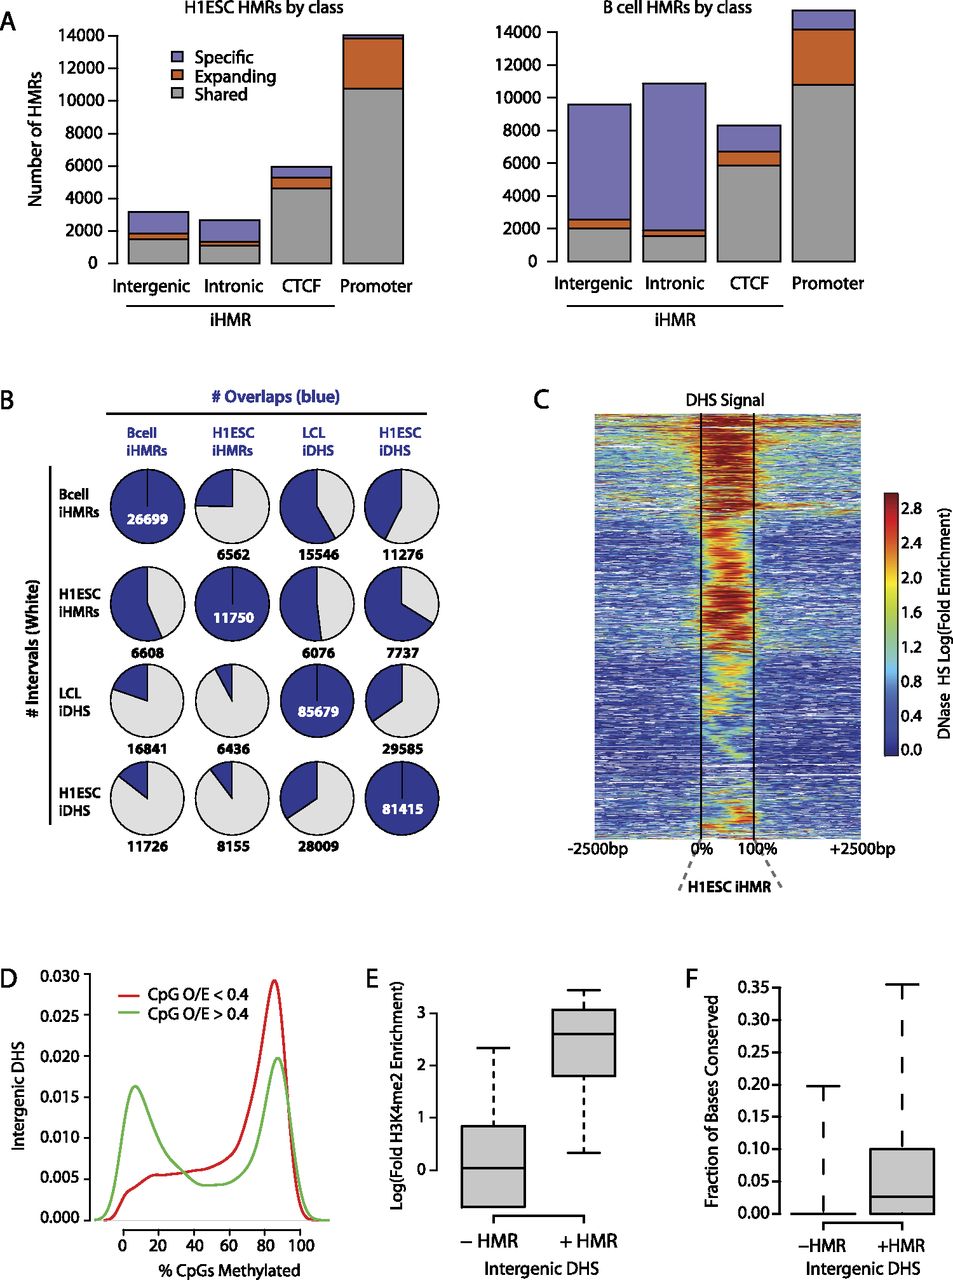
Distribution of hypomethylated regions in stem and differentiated cells. (A) Genomic distribution of hypomethylated regions (HMR) in H1 ESCs and B cells. Colors in each bar indicate whether an HMR is shared between the two cell types, specific to one, or shared but expanding, i.e., significantly larger in one cell type than in the other. (B) Overlap between iHMRs and DHS in the different cell-types. (C) Most iHMRs contain regions of DNase hypersensitivity. The heatmap shows the enrichment of DNase-seq signal at H1 ESC iHMRs. iHMRs are aligned between the black lines, white points indicate genomic locations not mappable with short DNase-seq reads. Rows are sorted by hierarchical clustering. (D) A subset of high CpG density DNase HS is hypomethylated. Distribution of average methylation levels for DHS in H1 ESC split by CpG density (observed/expected; O/E). (E) Hypomethylated DHS are marked by histone modifications. Log fold enrichment over genomic background for H3K4me2 at intergenic H1 ESC DHS with high (>0.4 O/E) CpG density is shown. (F) Hypomethylated DHS have higher sequence conservation. The fraction of positions with phastCons scores over 0.9 in intergenic DHS depending on methylation state is shown.


