
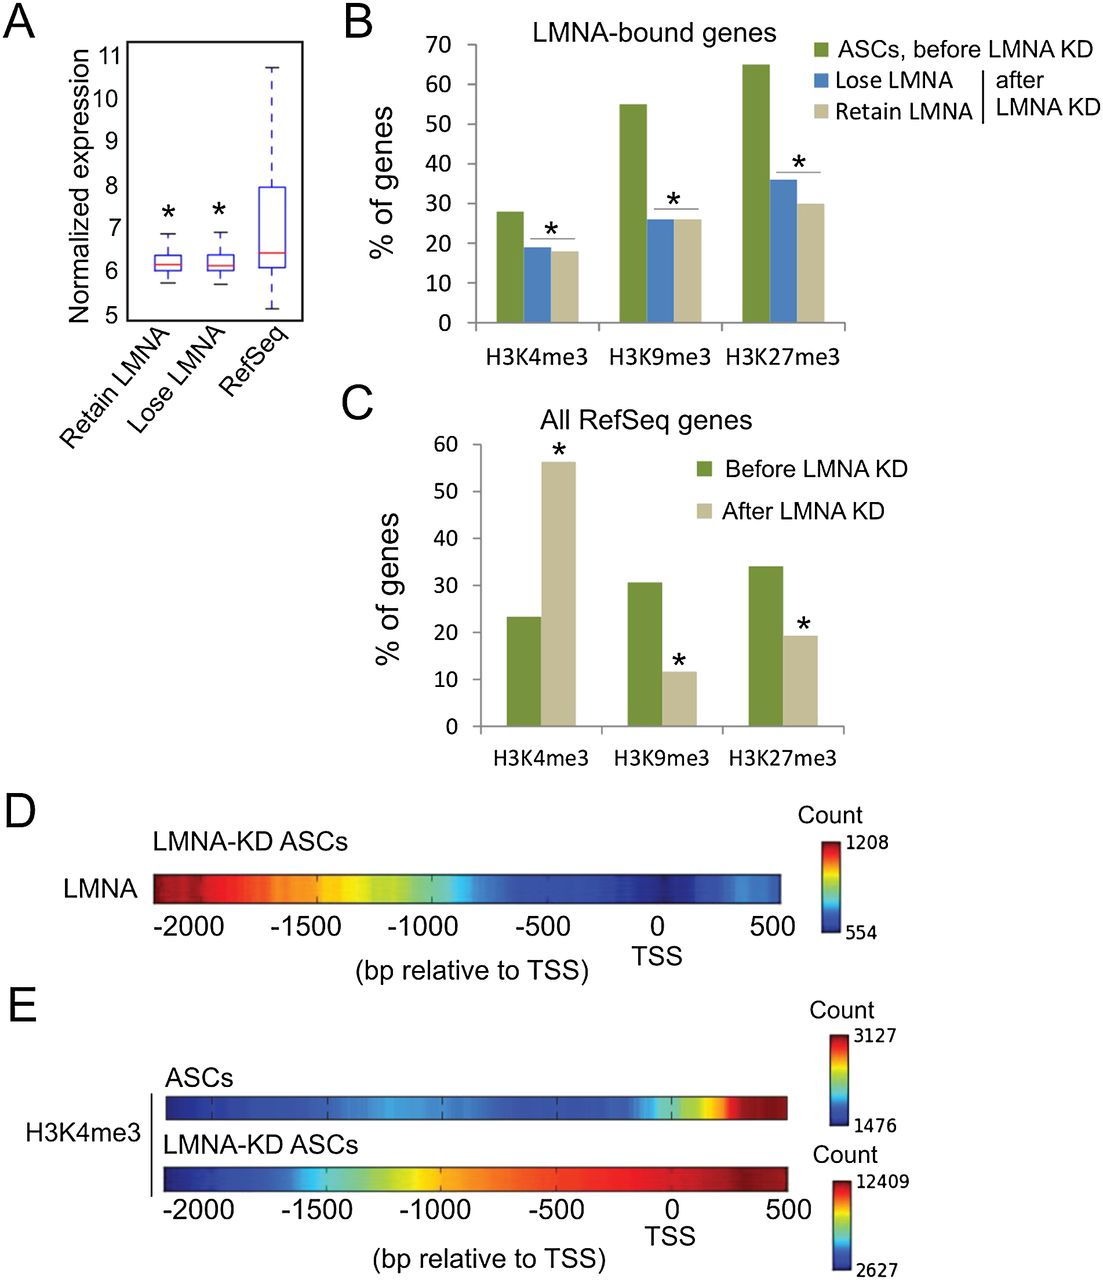
LMNA down-regulation results in chromatin rearrangement. (A) Expression level of genes that lose or retain LMNA after LMNA KD. (*) P < 10−6 relative to RefSeq genes; Wilcoxon ran sum test. (B) Proportion of H3K4me3-, H3K9me3-, or H3K27me3-marked genes that lose or retain LMNA after LMNA KD. (*) P < 10−4 compared to the percentage of genes bound by LMNA and enriched in the indicated histone modifications in ASCs; Fisher's exact test. (C) Proportion of RefSeq genes enriched in LMNA and H3K4me3, H3K9me3, or H3K27me3 in ASCs before (Native) and after LMNA KD. (*) P < 10−4 relative to native ASCs; Fisher's exact test. (D) LMNA peak density map on promoters retaining LMNA after LMNA KD. (E) H3K4me3 peak density map on all H3K4me3-enriched promoters before and after LMNA KD.


