
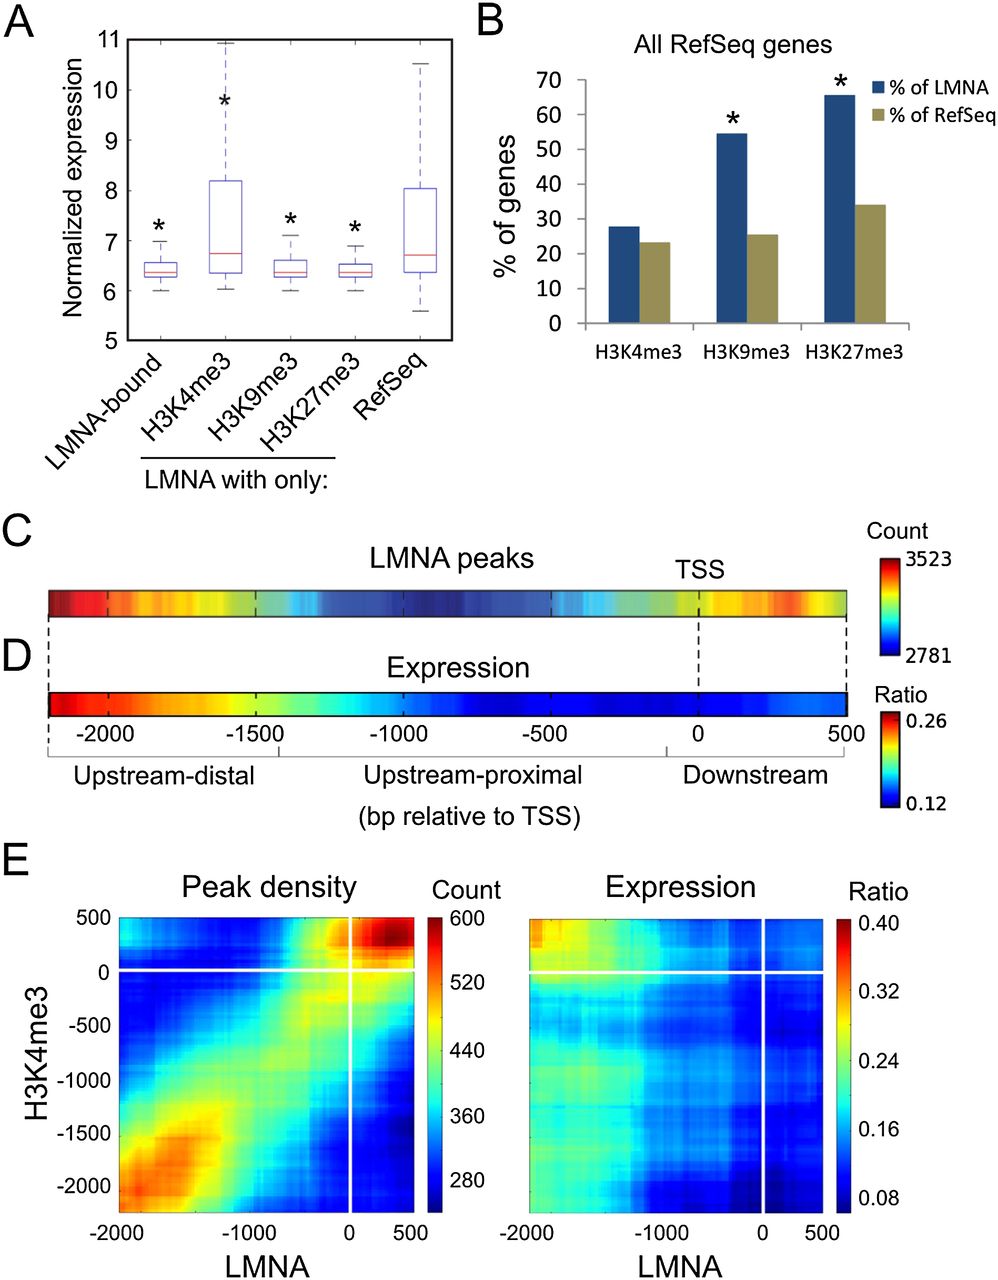
LMNA associates with a repressive chromatin environment and with distinct promoter subregions. (A) Expression level of genes enriched in LMNA and indicated histone modification. (*) P < 10−6 relative to RefSeq genes; Wilcoxon rank sum test. (B) Percentage of LMNA-associated and RefSeq genes enriched in H3K4me3, H3K9me3, or H3K27me3. (*) P < 10−4 relative to RefSeq; χ2 with Yates' correction. (C) Heat map of LMNA peak position on promoters (scale, no. of genes with a LMNA peak at a given position). (D) Corresponding expression frequency heat map (scale, ratio of expressed genes/all genes for a given offset from TSS). (E) 2D heat maps of LMNA and H3K4me3 peak position on co-enriched promoters, and corresponding expression heat map; scales are as in C and D.


