
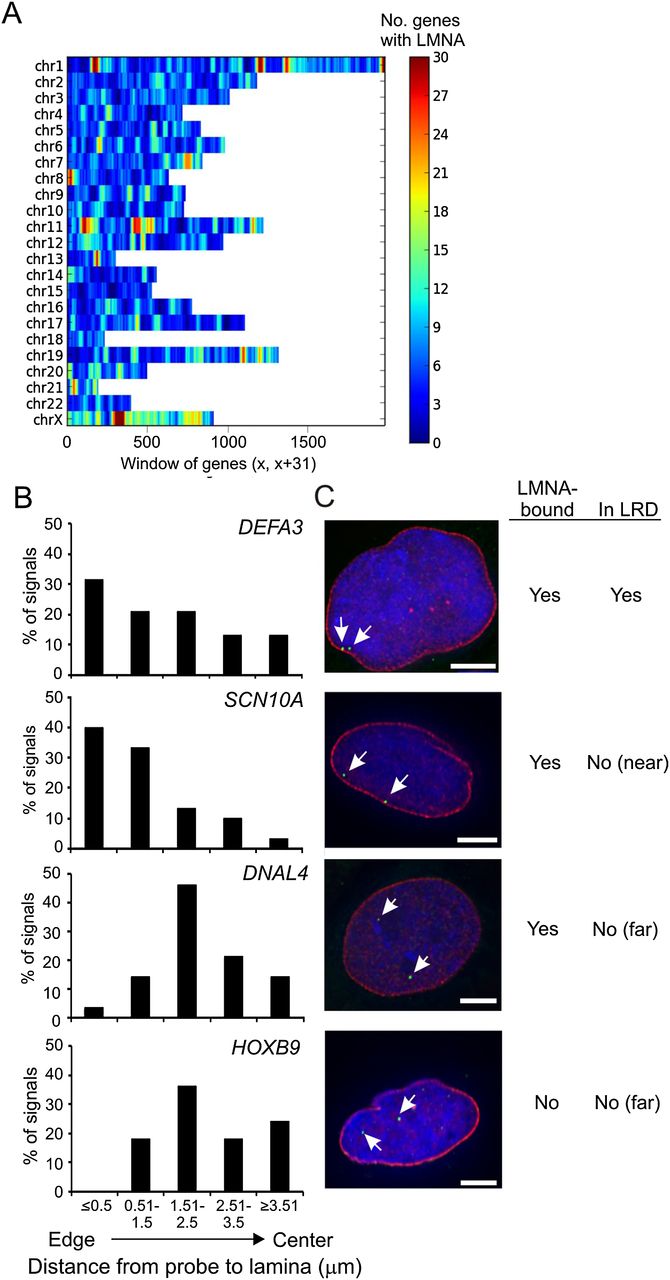
Figure 2.
3D immuno-FISH unveils peripheral and intra-nuclear LMNA-associated loci. (A) LMNA enrichment in sliding 31-gene windows (x, x+31) across chromosomes. Scale shows the numbers of LMNA-enriched genes in the window. (B) Distribution of FISH signals from LMNA-enriched (DEFA3, SCN10A, DNAL4) and nonenriched (HOXB9) loci relative to peripheral LMNA (n ≥ 30 loci per gene). (C) 3D immuno-FISH (green; arrows) of loci shown in B relative to peripheral LMNA labeling (red). DNA is stained with DAPI. Scale bars, 5μm.


