
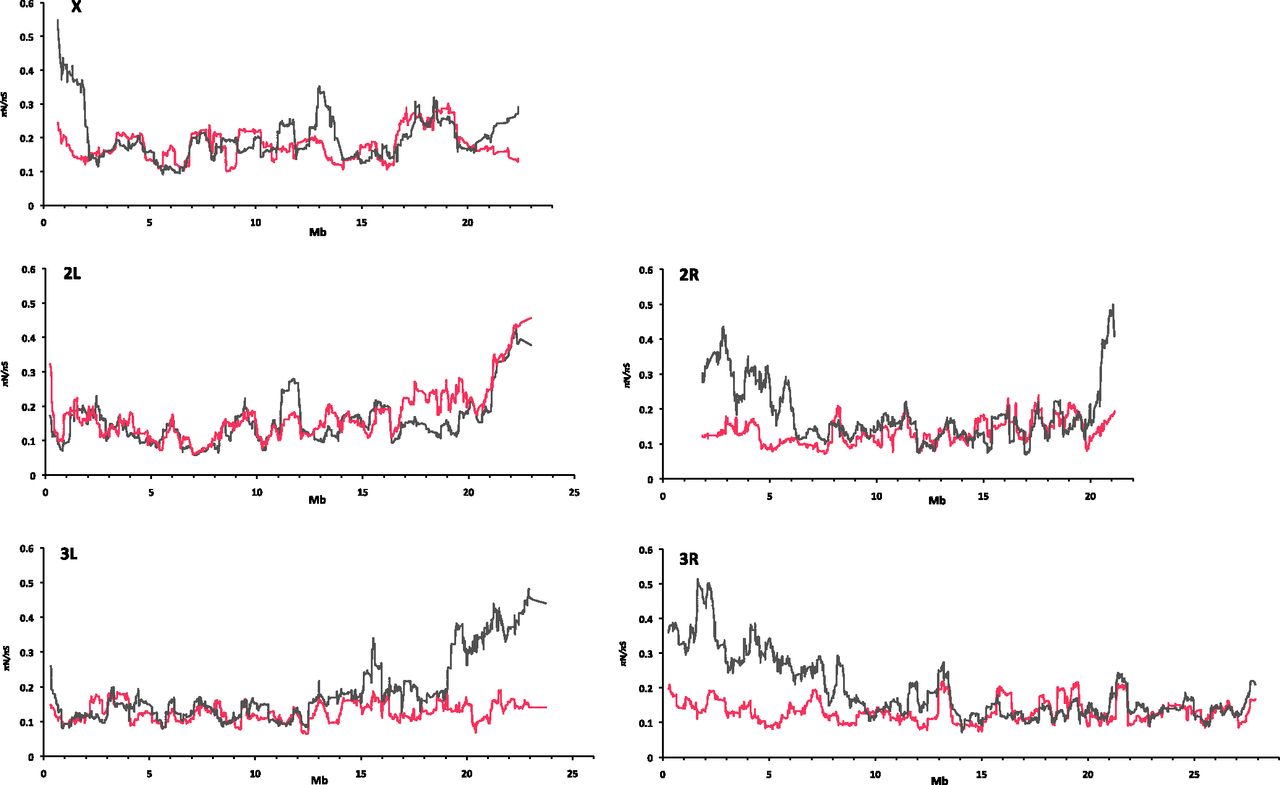
Figure 4.
Ratio of nonsynonymous and synonymous nucleotide diversity (πN/πS) along the major chromosomal arms in D. mauritiana (red line) and D. melanogaster (gray line). The sliding window analysis was performed using 50 genes per window and a step size of one gene. For D. mauritiana, genes from all four gene sets were included and matched with the orthologous gene in D. melanogaster. Genes with a πN/πS ratio >3 were excluded from both data sets.


