
Comparison of intralineage and interlineage clustering of nonsynonymous substitutions. For all comparisons,  (the correlation in divergence between nonsynonymous substitutions) decreases with increasing distance separating two nonsynonymous
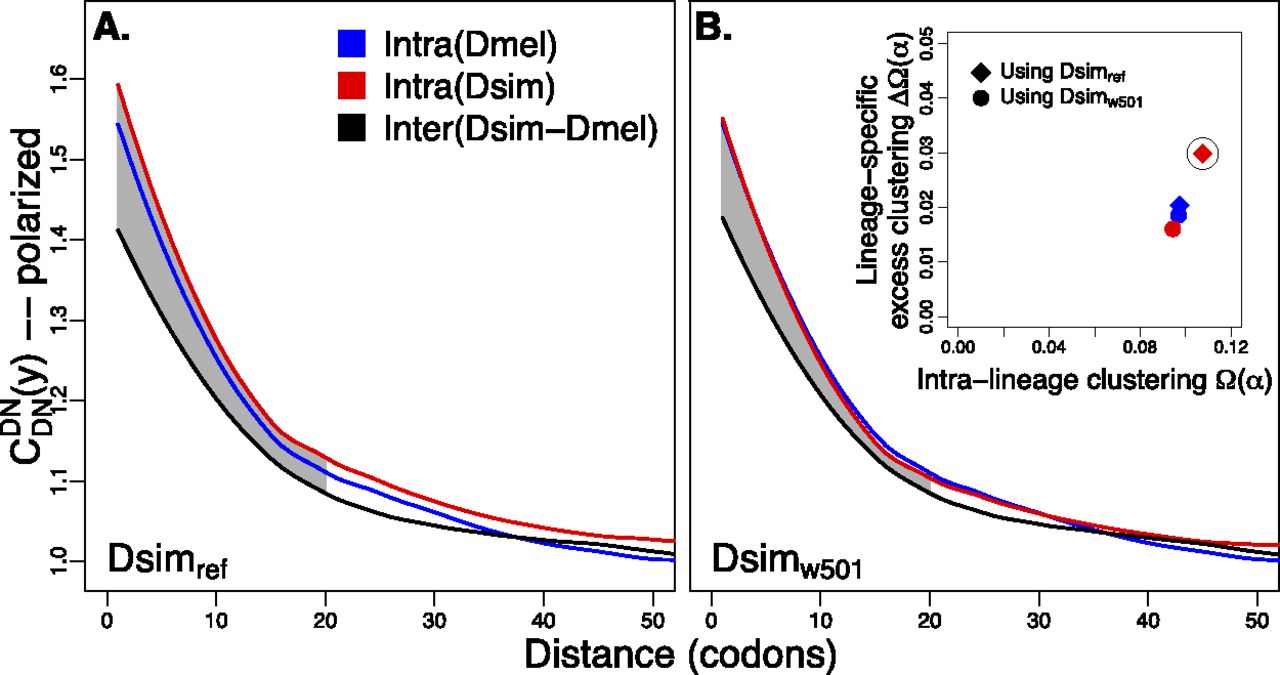
substitutions, specific to the lineage from which the substitution arose (polarized), following Figure 4A of Callahan et al. (2011). The amount of intralineage clustering within D. simulans (red line) and D. melanogaster (blue line) relative to interlineage clustering (black line) is shown separately for the two D. simulans assemblies: Dsimref (A); Dsimw501 (B). The excess of intralineage relative to interlineage clustering in D. simulans is represented by the area between the red and blue curves for the first 20 codons [
(the correlation in divergence between nonsynonymous substitutions) decreases with increasing distance separating two nonsynonymous
substitutions, specific to the lineage from which the substitution arose (polarized), following Figure 4A of Callahan et al. (2011). The amount of intralineage clustering within D. simulans (red line) and D. melanogaster (blue line) relative to interlineage clustering (black line) is shown separately for the two D. simulans assemblies: Dsimref (A); Dsimw501 (B). The excess of intralineage relative to interlineage clustering in D. simulans is represented by the area between the red and blue curves for the first 20 codons [ , shaded in gray]. Note that the same set of genes from both assemblies is analyzed, and D. simulans orthologs from either assembly containing a premature stop codon or non-start or stop codons are excluded. (B) Unlike the pattern from Dsimref, a similar amount of intralineage clustering is found in both the D. simulans and D. melanogaster lineages when using Dsimw501 (greater overlap between blue and red lines; shaded region in gray is smaller). The intralineage clustering excess
  relative to the extent of intralineage clustering
  is shown in the inset (following Fig. 4B of Callahan et al. 2011). A considerably larger intralineage clustering excess is found in the D. simulans lineage when using Dsimref, which is also circled in the inset.


