
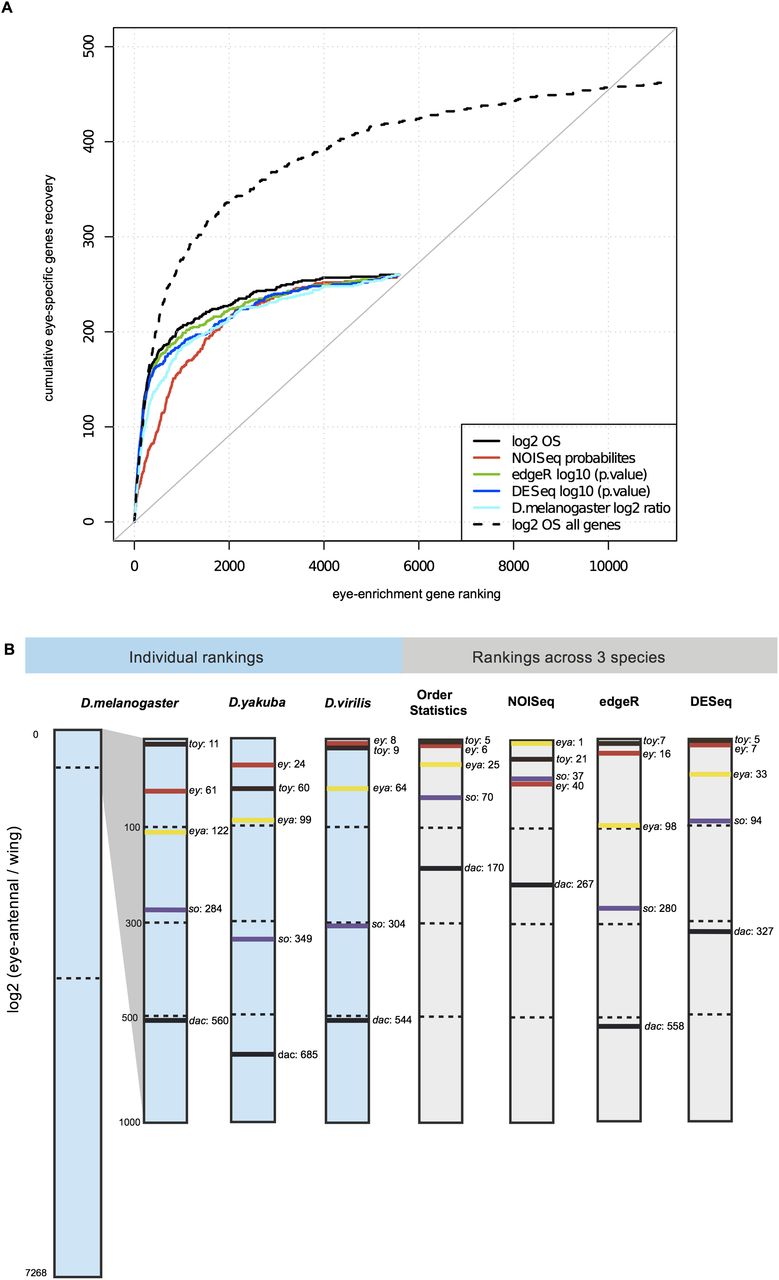
Cross-species analysis more robustly identifies eye-specific genes. (A) Comparison of rank aggregation using Order Statistics (OS; black curves) to integrate expression levels across species, with differential expression analysis using the species as replicates (blue, green, red); and with a single-species log-ratio ranking (cyan). (Black dashed curve) The recovery using all genes; (solid curves) using only genes with expression values in the three species (no missing values). The true-positive set is 507 eye-enriched genes from D. melanogaster obtained from microarray data (Ostrin et al. 2006). (B) Schematic visualization of individual and cross-species eye-versus-wing rankings, indicating the rank position of the RDGN genes so, toy, ey, eya, and dac, showing an increasing rank for all RDGN members in the cross-species ranking, in particular the OS ranking.


