
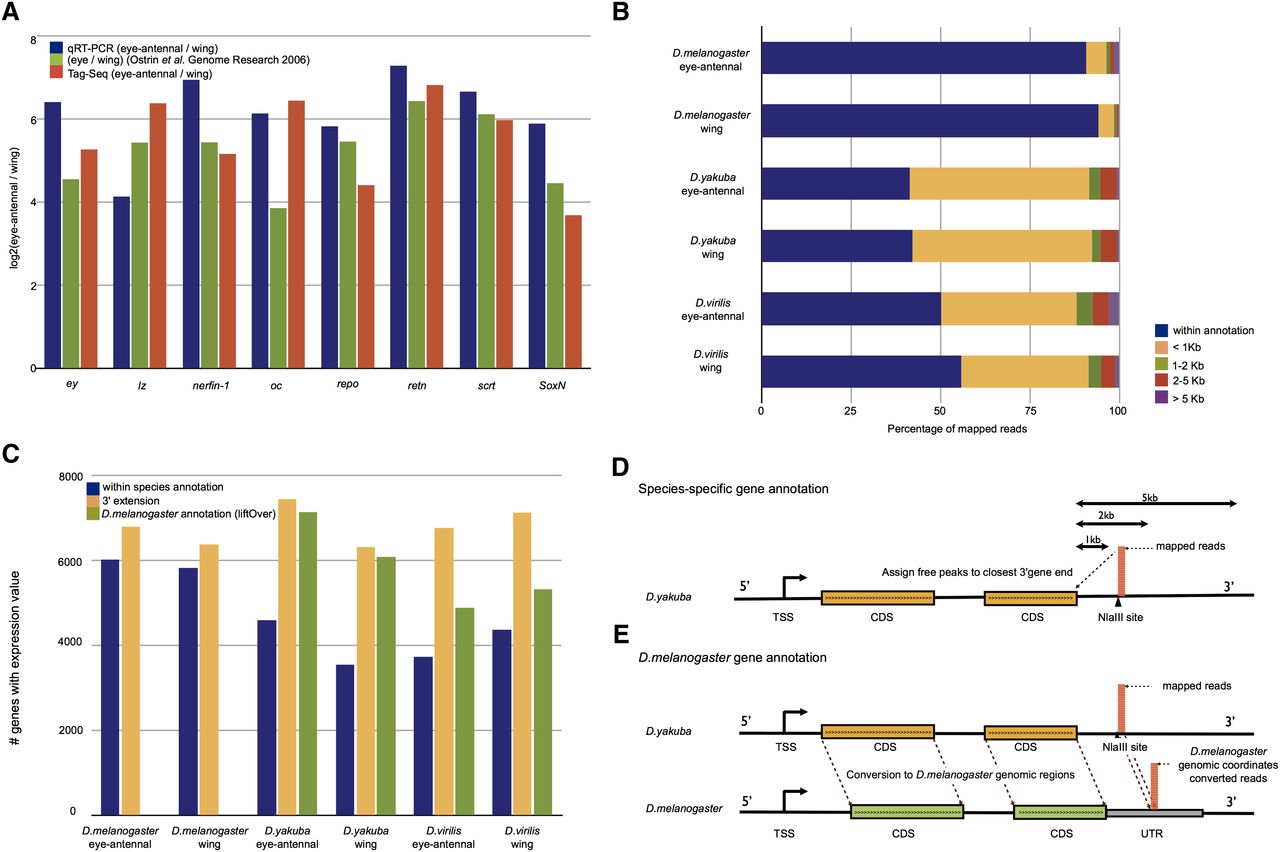
Tag-seq analysis D. melanogaster and other species. (A) Relative expression measures of eye-antennal imaginal discs versus wing imaginal discs, as fold-changes, of eight genes involved in eye development, namely, ey, lz, nerfin-1, oc, repo, retn, scrt, and SoxN. (Blue) Measures by qRT-PCR; (green) microarray; (orange) Tag-seq. (B) Percentage of mapped reads falling within the currently available species-specific gene annotation (blue), compared with reads falling 1 kb (yellow), 2 kb (green), 5 kb (red), or >5 kb (purple) downstream from an annotated gene. (C) Number of genes with more than 10 mapped reads in any of the two tissues, using different annotation procedures. (D,E) Overview of the two different methods to obtain gene expression levels in the other species, one using species-specific annotation with 3′ extension (D), the other by exploiting orthologous positions in D. melanogaster with D. melanogaster gene annotations (E).


