
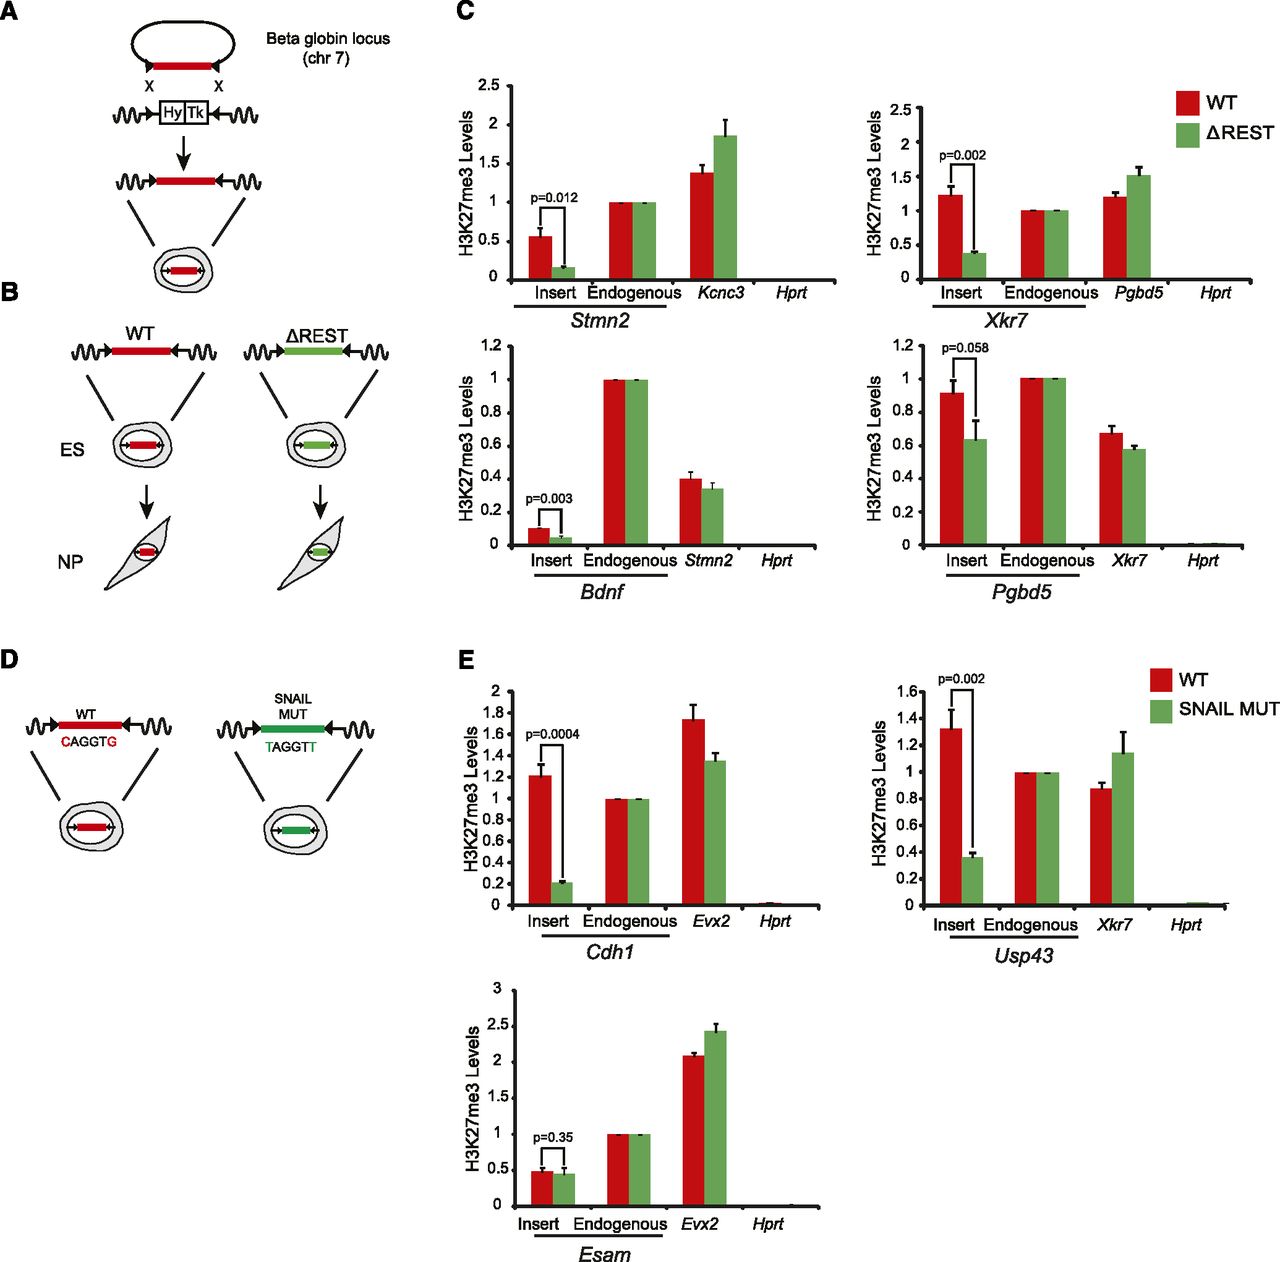
TFBS are required for H3K27me3 recruitment at the NP stage. (A) Strategy to insert promoter regions into a defined genetic site (beta globin locus) via RMCE. The two marker genes inserted into the beta globin locus confer resistance against hygromycin (Hy) and sensitivity against ganciclovir (Tk), respectively, and are flanked by two inverted lox sites (black triangles). Targeted insertion of a given transgene is achieved by Cre-mediated recombination and negative selection. (B) The RMCE approach was used to insert several REST target promoter fragments with either wild-type sequence (WT) or REST site mutation (ΔREST) into the beta globin locus. Correctly targeted ES cells were differentiated to the NP stage, where H3K27me3 and REST were measured at the inserted fragments. (C) For each of the four inserts H3K27me3 levels were measured in cells bearing the WT fragment (red bars) and in cells bearing the ΔREST fragment (green bars). Levels were measured at, from left to right in each panel, the inserted region, the corresponding endogenous locus, a positive control, and a negative control region. Note that different promoter regions are used as positive controls in the different panels. All inserted WT fragments show significant recruitment of H3K27me3 and loss in H3K27me3 for the ΔREST fragments. (D) Either wild-type (WT) or mutated (MUT) promoter regions containing predicted SNAIL sites were inserted via RMCE. The SNAIL sites were mutated by changing the first and last nucleotide of the motif to a Thymidine. Correctly targeted ES cells were differentiated to the NP stage. (E) For each of the three inserts H3K27me3 levels were measured in cells bearing the WT promoter (red bars) and in cells bearing promoters with mutated SNAIL sites (green bars). Note that the Cdh1, Usp43, and Esam promoter regions have three, two, and one predicted/mutated SNAIL site, respectively. Levels were measured at, from left to right in each panel, the inserted region, the corresponding endogenous locus, a positive control, and a negative control region. All H3K27me3 levels are scaled to that of the endogenous region and error bars show the standard error of three biological replicates. A P-value is shown and calculated for each insert using unpaired one-tailed t-test statistics.


